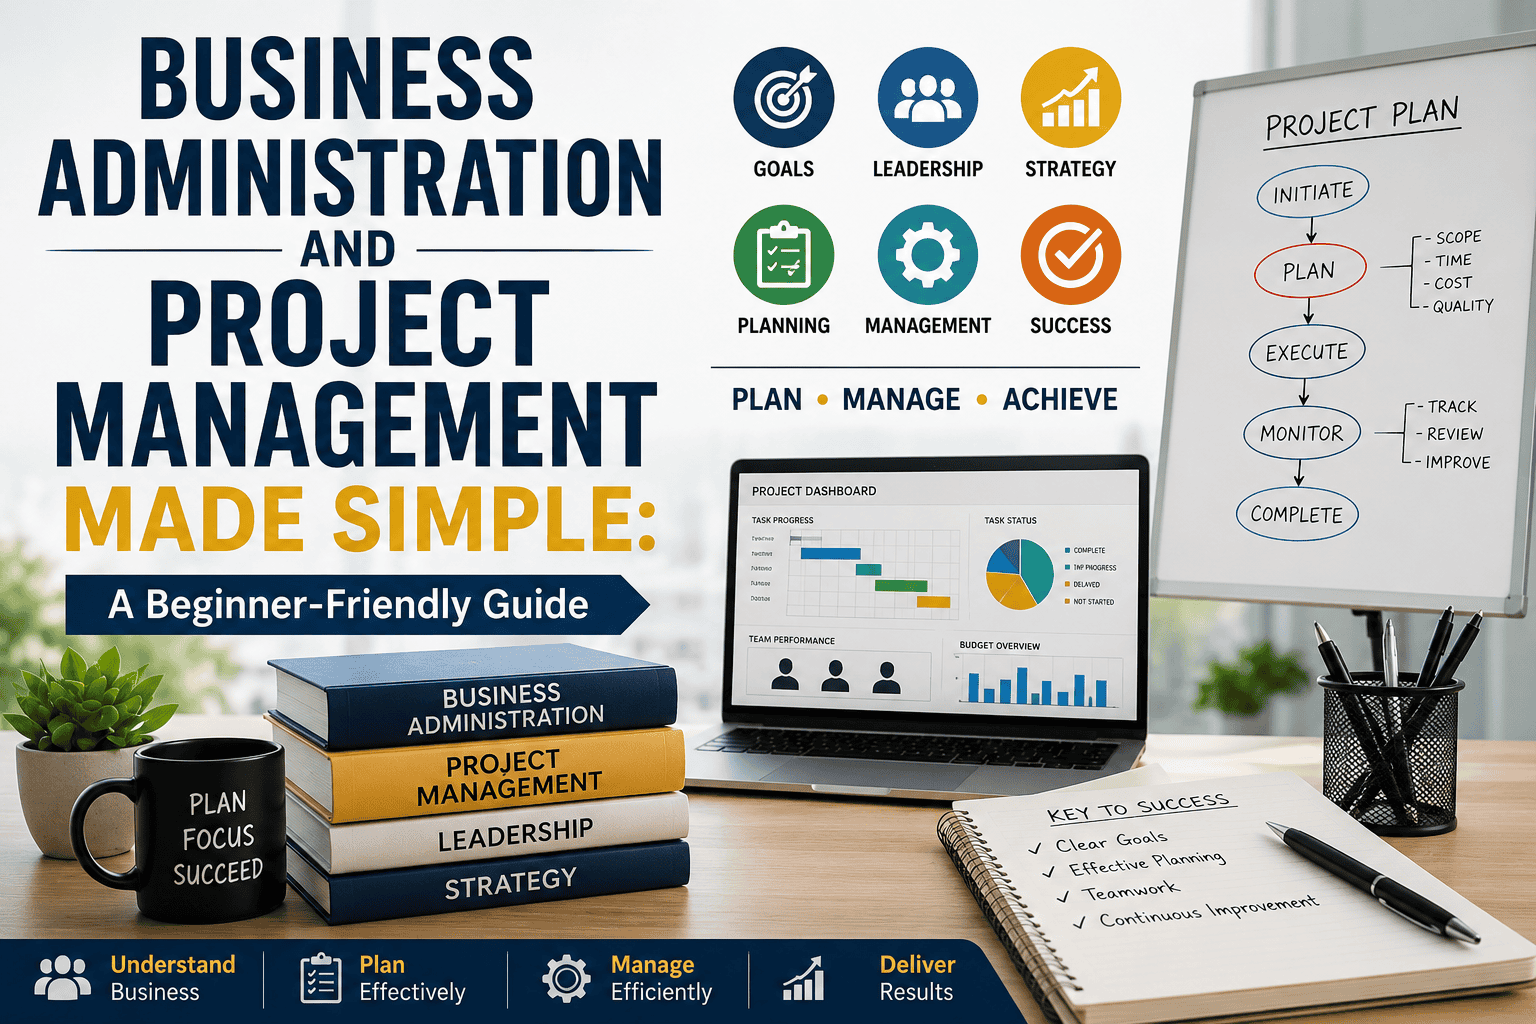
Business administration and Project Management
Discover how the right processes turn ideas into results. Business Administration and Project Management explores how organizations plan, coordinate, and execute work to achieve strategic goals — covering everything from budgeting and resource allocation to leadership, risk management, and team coordination. It blends managerial theory with practical frameworks like Agile and Waterfall, showing how structured planning transforms ambitious ideas into completed, measurable outcomes. This field examines how effective leaders balance competing priorities, timelines, and stakeholder needs while keeping projects on track and teams aligned. At its core, it asks how organizations turn vision into execution — efficiently, strategically, and successfully.
Content Overview
BUSINESS ADMINISTRATION FUNDAMENTALS – COMPLETE PROFESSIONAL GUIDE
1. INTRODUCTION TO BUSINESS
1.1 What is Business?
Business is the activity of producing, buying, or selling goods and services to meet the needs of consumers while generating profit. It encompasses management, operations, marketing, finance, and technology.
1.2 History of Business
Early Stage: Barter systems → simple trading of goods
Industrial Revolution (1760–1840): Mechanization → mass production → factories → emergence of management practices
Modern Era: Globalization, technology, e-commerce, corporate governance, analytics-driven decision-making
Example: In the 1800s, a small bakery sold bread within its local community, representing an early stage of business growth. Industrial Revolution bakery: mechanized ovens, larger distribution. Modern bakery: online orders, automated inventory, digital marketing.
Tools and uses: Microsoft Excel is used to track sales, manage inventory, and create simple reports, while Notion and Slack are used to document workflows and communicate across teams.
Practical Tip: Use Excel to create a sales forecast sheet for monthly revenue → track trends over time.
1.3 Core Business Functions
Business functions are key areas that keep a company running smoothly.
Operations: Production, supply chain, process optimization. Tools: ERP (SAP), Trello, Asana. Example: Shopify store uses Asana → track orders, manage supplier tasks.
Human Resources (HR): Recruitment, onboarding, performance management. Tools: BambooHR, Workday. Example: BambooHR → automate leave approvals, track employee performance.
Finance: Budgeting, accounting, financial reporting. Tools: QuickBooks, Excel, SAP Finance. Example: QuickBooks can be used to generate a monthly profit and loss report for a small business.
Marketing: Customer acquisition, branding, campaigns. Tools: HubSpot, Canva, Google Ads. Example: HubSpot → segment leads → send personalized email campaigns.
Information Technology (IT): Infrastructure, software, cybersecurity. Tools: Microsoft 365, Google Workspace, Slack. Example: IT team uses Slack → communicates about system issues → resolves quickly.
1.4 Business Models & Organizational Structures
Business Models
A business model describes how a company creates, delivers, and captures value. Examples: Subscription (Netflix), E-commerce (Amazon), Franchise (McDonald’s), SaaS (HubSpot).
Organizational Structures
Defines hierarchy, decision-making, and communication flow.
- Hierarchical: Traditional top-down → CEO → Managers → Employees. Example: Large corporations like Coca-Cola.
- Flat: Few levels of management → encourages collaboration. Example: Small startups → faster decision-making.
- Matrix structure combines functional and project teams, where employees report to more than one manager. Example: In tech companies, teams often work on both products and departments at the same time.
Tools and use: Organizational chart tools like Lucidchart and Canva are used to visually design and present organizational structures. Project Management (Trello, Jira) → assign tasks according to structure. Example: Use Lucidchart to design a matrix organizational chart, making responsibilities for marketing and product teams clear and well-defined.
1.5 Business Ethics & Corporate Governance
Business Ethics
Moral principles guiding business decisions. Focus: Fairness, honesty, transparency, responsibility.
Corporate Governance
Corporate governance is a framework of rules, practices, and processes used to manage and control a company. Includes: Board of Directors, CSR (Corporate Social Responsibility), ESG (Environmental, Social, Governance).
Key Concepts
- CSR: Company contributes to society (donations, sustainability).
- ESG: Measure impact of environment, social responsibility, and governance policies.
- Ethical Decision-Making Framework: Identify stakeholders → evaluate options → make responsible choice.
Example: Patagonia emphasizes ESG → sustainable sourcing, environmental campaigns → strengthens brand loyalty.
Tools: Use Microsoft Excel or Power BI to track ESG KPIs, and Notion or Confluence to document ethics policies. Example: Create a dashboard in Power BI → track carbon footprint reduction over the year.
1.6 Essential Business Tools
Here’s a deep dive into tools with setup and example use.
Microsoft Excel: Use: Accounting, dashboards, analysis. Setup: Install → Templates → PivotTables, Charts. Example: Track monthly sales → calculate gross margin → visualize trends.
QuickBooks: Use: Accounting for small to medium businesses. Setup: Install → Add company info → Connect bank accounts → Track expenses & invoices. Example: Generating a profit and loss report helps identify products that are causing losses.
Salesforce: Use: CRM, sales pipeline management, customer segmentation. Setup: Register an account, add your contacts, create leads and campaigns, then set up automated emails. Example: Segment leads based on engagement → send personalized marketing emails.
SAP: Use: Enterprise resource planning → integrates finance, operations, HR. Setup: Enterprise subscription → configure modules → train employees. Example: Automate inventory management → sync with suppliers → avoid stockouts.
Power BI / Tableau: Used for business intelligence dashboards and data visualization.Setup: Connect data sources (Excel, SQL, Salesforce) → build interactive dashboards. Example: Visualize monthly revenue by region → identify high-performing markets.
Notion / Slack: Use: Collaboration, project documentation, communication. Setup: Sign up, create a workspace, then set up channels and pages. Example: Document workflows in Notion → team collaborates seamlessly → track project status.
Summary Example Workflow
- Operations: Track production → Excel dashboard
- Finance: QuickBooks → calculate profit, monitor cash flow
- Marketing: HubSpot → segment leads, launch campaigns
- IT / Collaboration: Slack and Notion are used to document projects and enable real-time communication.
- Reporting: Power BI → interactive dashboards showing KPI performance
2. ECONOMICS FUNDAMENTALS
2.1 Microeconomics
Microeconomics focuses on how individual consumers, businesses, and markets behave and make decisions. It focuses on how these entities make decisions about pricing, production, and resource allocation.
Core Concepts
Supply & Demand
Supply – The amount of a product or service that producers are prepared to offer for sale at various price levels. Demand: The amount of a product that people are ready to purchase at various prices. Equilibrium: Price where supply equals demand.
Example: If a smartphone company produces 10,000 phones but demand is 15,000 → shortage → price likely increases.
Tools and use: Microsoft Excel is used to create supply–demand tables and graphs, while Python (with libraries like Matplotlib and Seaborn) is used to plot demand and supply curves and analyze equilibrium price.
Elasticity
Price Elasticity of Demand (PED): It shows how much the quantity demanded changes when the price changes, calculated as the percentage change in quantity demanded divided by the percentage change in price.
Example: PED for luxury watches = 2 → if price increases 10%, demand decreases 20%.
Tools & Use: Excel → Calculate PED → plot elasticity graphs. Python → NumPy + Pandas → simulate elasticity under different scenarios.
Pricing Strategy
Methods firms use to set prices to maximize profit. Examples: Penetration Pricing, Skimming, Dynamic Pricing.
Example: Amazon uses dynamic pricing → price changes based on competition & demand.
Tools & Use: Excel → calculate optimal price based on cost & projected demand. Python → run pricing simulations using historical sales data.
Cost & Production Theory
Fixed Costs (FC): Costs that do not change (rent, salaries). Variable Costs (VC): Costs that vary with production (raw materials). TC = FC + VC
Total cost is the sum of fixed and variable costs, while marginal cost is the cost of producing one additional unit.
Example: Producing 100 units of shoes → TC = $1,000, producing 101 units → TC = $1,010 → MC = $10.
Tools & Use: Excel → Cost calculation tables. Python: Used to build production and cost models to estimate the best level of output.
2.2 Macroeconomics
Macroeconomics studies economy-wide phenomena, such as GDP, inflation, unemployment, and government policies.
Core Concepts
GDP (Gross Domestic Product)
Gross Domestic Product (GDP) is the total value of all goods and services produced within a country.
Example: US GDP = $26 trillion (2025) → indicator of economic health.
Tools & Uses: Use World Bank and IMF datasets to examine GDP patterns, then use Excel or Power BI to analyze and visualize changes in economic growth.
Inflation
Rise in general price level → decreases purchasing power.
Example: Inflation = 5% → $100 buys only $95 worth of goods next year.
Tools and uses: Trading Economics and FRED are used to access historical inflation data, while Microsoft Excel is used to calculate CPI and analyze inflation trends.
Fiscal Policy
Government choices about taxation and spending to control and guide the economy.
Example: Tax cuts → increase consumer spending → stimulate growth.
Tools and use: Python and Microsoft Excel are used to simulate the effects of fiscal policy on GDP and consumption.
Monetary Policy
Actions taken by a central bank to control money supply and interest rates are known as monetary policy.
Example: Lower interest rates tend to encourage borrowing and investment.
Tools and use: Stata and Microsoft Excel are used to model how interest rates influence investment and consumption.
2.3 International Business
International business studies cross-border trade, globalization, and managing operations in multiple countries.
Core Concepts
Globalization: the process by which economies become interconnected through international trade and investment.
Example: Apple sources parts from China, assembles in US → global supply chain.
Cross-Cultural Management: Managing workforce across diverse cultures.
Example: Marketing campaigns in India vs USA → adjust language, imagery, pricing.
Tools and use: Microsoft Excel, Tableau, and Power BI are used to analyze international sales, currency exchange, and market data; Google Analytics tracks global website traffic and user behavior; while Slack and Notion support collaboration across global teams.
Practical Example
Suppose you manage a global e-commerce store:
- Use Excel / Power BI to analyze country-wise demand → optimize supply chain
- Calculate Price Elasticity → adjust local pricing dynamically
- Track inflation & currency exchange → update cost & margins
- Apply cross-cultural management → create targeted campaigns for each region
3. FINANCIAL MANAGEMENT
3.1 Financial Accounting
Financial Accounting involves recording, summarizing, and reporting a business’s financial transactions to produce financial statements: Income Statement, Balance Sheet, Cash Flow Statement. It provides an overview of a company’s financial health for external stakeholders.
Scenario Example
Business Setup: Mr. X starts a small coffee shop called “X-Café” in 2026. He invests $10,000 cash into the business.
Transactions (First Month):
| Date | Transaction | Debit | Credit | Amount |
|---|---|---|---|---|
| Jan 1 | Owner invests capital | Cash | Capital | $10,000 |
| Jan 2 | Buy coffee beans (inventory) | Inventory | Cash | $1,000 |
| Jan 5 | Rent payment | Rent Expense | Cash | $500 |
| Jan 10 | Sold coffee (Revenue) | Cash | Sales Revenue | $2,000 |
| Jan 12 | Paid salaries | Salaries Expense | Cash | $600 |
| Jan 20 | Bought equipment | Equipment | Cash | $1,500 |
| Jan 25 | Utilities paid | Utilities Expense | Cash | $200 |
Accounting Cycle (Step by Step)
Step 1: Identify Transactions
Each financial activity (buying, selling, paying) is identified. Example: Jan 2, coffee beans purchased → affects Inventory & Cash.
Step 2: Journal Entries
Record each transaction in journal format (Date, Debit, Credit, Amount). Example: Jan 2: Inventory (Debit) $1,000, Cash (Credit) $1,000.
Step 3: Posting to Ledger
Each account (Cash, Inventory, Sales, Expenses) has a ledger showing debits and credits.
Ledger Example – Cash Account
| Date | Description | Debit | Credit | Balance |
|---|---|---|---|---|
| Jan 1 | Capital | 10,000 | – | 10,000 |
| Jan 2 | Inventory | – | 1,000 | 9,000 |
| Jan 5 | Rent Expense | – | 500 | 8,500 |
| Jan 10 | Sales Revenue | 2,000 | – | 10,500 |
| Jan 12 | Salaries | – | 600 | 9,900 |
| Jan 20 | Equipment | – | 1,500 | 8,400 |
| Jan 25 | Utilities | – | 200 | 8,200 |
Step 4: Trial Balance
Summarize all ledger accounts to ensure total debits = total credits.
| Account | Debit | Credit |
|---|---|---|
| Cash | 8,200 | – |
| Inventory | 1,000 | – |
| Equipment | 1,500 | – |
| Rent Expense | 500 | – |
| Salaries Expense | 600 | – |
| Utilities Expense | 200 | – |
| Capital | – | 10,000 |
| Sales Revenue | – | 2,000 |
| Total | 12,000 | 12,000 |
Step 5: Financial Statements
Income Statement (Profit & Loss):
| Item | Amount |
|---|---|
| Revenue (Sales) | 2,000 |
| Less Expenses | 1,300 |
| Rent 500 + Salaries 600 + Utilities 200 | 1,300 |
| Net Profit | 700 |
A balance sheet shows a company’s financial position, where assets are equal to the sum of liabilities and equity.
| Assets | Amount | Liabilities & Equity | Amount |
|---|---|---|---|
| Cash | 8,200 | Capital | 10,000 |
| Inventory | 1,000 | Net Profit | 700 |
| Equipment | 1,500 | ||
| Total Assets | 10,700 | Total Liabilities + Equity | 10,700 |
Cash flow statement: presents the inflow and outflow of cash. Example: Cash from Sales $2,000, Cash spent on Expenses $2,300 → Net Outflow $300.
Tools: Use Microsoft Excel to build ledgers and financial statements, QuickBooks for automated accounting, SAP, Tally, or Xero for enterprise accounting, and Power BI or Tableau for financial dashboards and analysis.
3.2 Managerial Accounting
Managerial accounting focuses on providing information for internal decisions instead of external reporting. It helps managers make strategic decisions about costs, pricing, and investments.
Examples: Which menu items are most profitable? How much to invest in new coffee machines?
Tools & Use: Excel (Cost & budget sheets), Power BI (Visualize product profitability), Tableau (Trend analysis for internal performance).
Costing & Budgeting
Costing: Calculating all expenses involved in producing goods or services. Budgeting: Planning future expenses & revenues.
Types of Costs
- Fixed Costs: Rent, salaries
- Variable Costs: Raw materials, packaging
- Semi-Variable Costs: Utility bills (part fixed, part variable)
Example (Coffee Shop)
| Item | Type | Amount |
|---|---|---|
| Rent | Fixed | $500 |
| Coffee Beans | Variable | $1,000 |
| Salaries | Fixed | $600 |
| Cups & Napkins | Variable | $100 |
| Utilities | Semi-variable | $200 |
| Total Costs | $2,400 |
Budgeting Method
Zero-based budgeting: Every expense must be justified. Incremental budgeting: Base last year’s budget + adjustments.
Tools and uses: Microsoft Excel and Google Sheets are used to build cost tables and budget templates, while Microsoft Power BI and Tableau are used to visualize budget versus actual performance.
Financial Analysis
Financial analysis evaluates a company’s profitability, liquidity, and debt management to make investment or operational decisions.
Common Ratios
- Profitability: Net Profit Margin = Net Profit / Revenue. Example: 700 / 2000 = 35%.
- Liquidity: The current ratio measures liquidity by dividing current assets by current liabilities.
- Debt Ratio: Total Debt / Total Assets.
Tools & Use: Excel (Ratio calculation & trend graphs), Power BI / Tableau (Interactive dashboards for ratios).
Example: X-Café Current Assets $10,700, Current Liabilities $2,000 → Current Ratio = 5.35 → financially healthy.
Investment Management
Investment management is making strategic decisions on how to distribute funds to support growth and increase profits.
Topics: Investment Decisions (Buy coffee machines or expand location?), Capital Management (How much cash to retain vs invest), CMA / CFA Level 1 (Professional certifications for deeper expertise).
Tools & Uses: Excel and Python can be used to calculate financial metrics such as ROI, NPV, and IRR. Power BI and Tableau help present investment performance and returns through interactive visualizations, while CFA study resources such as Wiley and Kaplan can support preparation for professional certification exams.
Example: Buy a new coffee machine costing $2,000 expected to increase revenue by $500/month → ROI = 500 * 12 / 2,000 = 3 → 300% annual return.
Practical Takeaways
- Follow accounting cycle for accurate records
- Use managerial accounting for operational decisions
- Track financial ratios to evaluate health
- Analyze cost & budget before major investments
- Use Excel + BI tools for clarity, visualization, and scenario modeling
4. MARKETING FUNDAMENTALS
4.1 Traditional vs Digital Marketing
Marketing is the practice of promoting products or services to reach customers and generate sales. Marketing has shifted from traditional approaches to digital platforms.
Traditional Marketing
- Channels: TV, radio, print ads, billboards, flyers
- Pros: Broad reach, brand awareness, tangible
- Cons: Expensive, difficult to track ROI, less targeted
Example: A coffee shop uses flyers and newspaper ads to attract local customers. Tools: Canva (flyer design), Adobe Illustrator.
Digital Marketing
- Channels: Key digital marketing channels include social media, SEO, SEM, PPC advertising, email campaigns, and content marketing.
- Pros: Measurable, cost-effective, targeted, interactive
- Cons: Requires technical skills, constant updates
Example: X-Café runs Instagram ads targeting users within 5 km radius using Meta Business Suite.
Tools & Setup:
- Google Analytics 4 is used to monitor website traffic, analyze user behavior, and measure conversions. Setup: Add GA4 tracking code to website header.
- HubSpot: Manages marketing campaigns, email automation, and CRM. Setup: Create free account → add forms & email sequences.
- Hootsuite / Buffer: Social media management. Setup: Connect accounts → schedule posts → analyze performance.
4.2 Brand Positioning
Brand positioning is how your brand is perceived in the minds of customers relative to competitors.
Types
- Premium Positioning: High-quality, high-price, luxury image (e.g., Starbucks)
- Affordable Positioning: Value-focused, budget-friendly (e.g., Dunkin Donuts)
Positioning Formula
Our brand is presented as a [category] that delivers a distinct value to its intended audience.
Example: X-Café is a local coffee shop offering affordable organic coffee for young professionals.
Tools & Uses: Canva can be used to design logos and other brand-related visuals, while Miro helps create visual positioning maps. SWOT analysis provides a structured way to assess an organization’s strengths, weaknesses, opportunities, and potential threats.
4.3 Consumer Behavior & Market Research
Consumer behavior is understanding why customers buy, their preferences, and decision-making patterns.
Primary Research
Information obtained first-hand from methods like surveys, interviews, and focus groups. Example: X-Café sends an online survey via Google Forms asking customers their preferred coffee flavors.
Secondary Research
Using existing data: market reports, industry studies, competitor websites. Example: Using Statista reports to see coffee consumption trends.
Market Research Types
- Quantitative: Surveys with numerical responses → % of customers preferring latte over cappuccino.
- Qualitative: Interviews, focus groups → reasons behind preference.
Tools & Setup: Google Forms or Typeform can be used to design surveys, gather responses, and export the collected data for further analysis. Excel and Power BI help analyze the results and present patterns or trends visually, while HubSpot CRM can be used to organize customer preferences and monitor interactions.
4.4 Digital Marketing Channels
Channels are platforms to reach potential customers digitally.
Social Media Marketing (SMM): Platforms: Facebook, Instagram, TikTok, LinkedIn. Example: X-Café shares Instagram reels to showcase and promote its new flavors. Tools: Meta Business Suite for ad campaigns and scheduling.
Content Marketing: Blogs, videos, infographics, podcasts. Example: Create a blog “5 Best Coffee Recipes” on WordPress → share on social media. Tools: WordPress (blog platform), Canva (graphics), ChatGPT (content ideas).
SEO (Search Engine Optimization): Improves organic website ranking. Example: Optimize blog post “Best Coffee Beans 2026” with keywords → increases Google search traffic. Tools: SEMrush (keyword research), Ahrefs (backlinks), Google Search Console (performance tracking).
SEM / PPC: Paid advertising on search engines. Example: Google Ads targeting “organic coffee near me”. Tools: Google Ads Manager, GA4 for conversion tracking.
4.5 Marketing Tools & Certifications
| Tool | Purpose | Setup / Use Example |
|---|---|---|
| Google Analytics (GA4) | Track website traffic, user behavior, conversions | Add GA4 tracking code → create events → analyze traffic sources |
| SEMrush | Keyword research, competitor analysis, SEO tracking | Search keyword “organic coffee” → check competitors → optimize content |
| HubSpot | CRM, email automation, inbound marketing | Add forms → create email sequence → track leads |
| Hootsuite / Buffer | Social media scheduling & analytics | Connect IG, FB → schedule posts → monitor engagement |
| Google Digital Marketing Certification | Learning credential | Study modules → complete assessments → certificate awarded |
| HubSpot Content Marketing Certification | Learning credential | Learn content strategy → pass test → certification |
Practical Example Combining Concepts
Scenario: X-Café wants to increase sales by 20% in 3 months.
- Conduct market research: Survey local coffee lovers via Google Forms → find most preferred flavors
- Position brand: Affordable premium coffee for young professionals
- Create content strategy: Blog on “5 Latte Recipes” + Instagram reels
- Run SEO and SEM campaigns by focusing on keywords like “affordable organic coffee near me”
- Use HubSpot CRM: Track leads, segment users for email campaigns
- Measure ROI: Track revenue increase via GA4 & Google Ads → adjust strategy
This approach integrates strategy, content, channels, tools, and tracking, providing a complete marketing plan.
5. HUMAN RESOURCE MANAGEMENT
5.1 Talent Management: Recruitment & Talent Acquisition
Talent management involves attracting, hiring, developing, and retaining skilled employees to meet organizational goals. Talent acquisition is the strategic approach to identifying and hiring the right candidates.
Recruitment Steps
- Job Analysis: Define role, skills, and responsibilities. Example: Coffee shop wants a Barista → skills: latte art, customer service.
- Sourcing Candidates: Finding potential employees through job portals, LinkedIn, referrals, and career fairs. Tools: LinkedIn Recruiter, Indeed, Naukri.com. Setup Example: Post job → filter applicants by experience → shortlist candidates.
- Screening and Shortlisting: Reviewing resumes, conducting initial interviews, and using assessment tests to select suitable candidates.
- Interview and Selection: Carrying out structured interviews, evaluating skills through tests, and choosing the best candidate. Example: Give a 30-minute hands-on test where the candidate prepares a latte, then assess its taste and presentation.
- Onboarding: Introduce company policies, team integration, role training.
Tools & Uses: SAP SuccessFactors supports the complete talent-management process, from job postings and candidate tracking to onboarding. Workday’s recruitment features help manage applicants and coordinate interviews, while Excel can be used to maintain candidate records, interview evaluations, and skill matrices.
5.2 Performance Management
Performance management is the process of monitoring, evaluating, and improving employee performance aligned with organizational goals.
Key Activities
- Employee Engagement: Surveys, feedback sessions, recognition programs. Tools: SurveyMonkey, Officevibe. Example: Monthly engagement survey → action plan for low-score areas.
- Performance Reviews: Annual/quarterly evaluation using KPIs. Example: Barista evaluated on punctuality, sales upsell, customer feedback.
- Goal Setting and Monitoring: Using SMART goals that are clear, measurable, realistic, relevant, and set within a specific time frame. Tools: Workday Performance Module, Excel KPI Tracker.
5.3 Compensation & Benefits
Compensation is the salary and rewards given to employees. Benefits include health, insurance, leave, and perks.
Components
- Salary Structures: Fixed pay + performance bonuses. Example: Barista salary = $1200/month + 10% monthly sales bonus.
- Benefits Packages: Health insurance, paid leave, flexible work, retirement contributions.
Tools: SAP SuccessFactors Compensation Module, Excel Salary Calculator.
Practical Example – Build a salary sheet in Excel:
| Employee | Base Salary | Bonus % | Total Compensation |
|---|---|---|---|
| John | 1200 | 10% | 1320 |
5.4 Workplace Culture
Workplace culture is creating a workplace where employees feel valued, included, and motivated.
Key Areas
- Ethics: Policies for integrity, honesty, anti-bribery, harassment.
- Diversity and Inclusion: Providing equal opportunities regardless of gender, ethnicity, or religion.
- Culture Building: Team-building events, open communication, feedback loops.
Example: Company celebrates cultural festivals → promotes inclusion. Implements anonymous feedback → ethical transparency.
Tools & Use: Microsoft Teams / Slack (Communication & collaboration), Officevibe (Measure employee engagement and inclusivity).
5.5 HR Analytics: Data-Driven HR Decisions
HR analytics uses data to make decisions about recruitment, retention, performance, and workforce planning.
Applications
- Attrition Prediction: Identify employees likely to leave → take retention measures.
- Recruitment Analytics: Which sourcing channels deliver best candidates.
- Performance Analytics: KPI tracking → identify training needs.
Tools & Uses: Excel can be used to create HR dashboards that track metrics such as turnover and absenteeism. Power BI helps visualize employee information, retention patterns, and performance comparisons, while SAP SuccessFactors and Workday Analytics can provide dashboards and predictive insights for HR decision-making.
Example: Build a dashboard in Power BI: X-axis (Departments), Y-axis (Performance Score), Filter (Employee tenure) → visualize high-performing, long-tenured employees.
5.6 HR Certifications
Professional certifications validate HR expertise and improve career prospects.
Popular Certifications
- PHR (Professional in Human Resources): Core HR knowledge, HR laws, talent management.
- SHRM-CP (Society for Human Resource Management – Certified Professional): Strategic HR, compliance, HR policies.
Tools and setup: Online courses from Society for Human Resource Management and HR Certification Institute, study modules covering recruitment, employee relations, and compensation and benefits, and exams conducted online or in person with multiple-choice questions and case studies.
Practical Example: PHR exam: Candidate studies HR laws, performs case analysis → passes certification → HR role promotion.
Practical Example Combining HR Concepts
Scenario: X-Café wants to scale to 5 branches → needs HR system.
- Talent Management: Post job ads via LinkedIn → onboard 10 baristas via Workday
- Performance Management: Set KPI → track with Excel → monthly feedback
- Compensation and benefits: develop salary and bonus structures and manage them using SAP SuccessFactors.
- Workplace Culture: Organize diversity and inclusion activities and track employee engagement using Officevibe
- HR analytics: use a Power BI dashboard to track employee retention and performance.
- Certifications: HR Manager completes SHRM-CP → improves HR policy strategy
6. OPERATIONS MANAGEMENT
6.1 Supply Chain Fundamentals
Supply chain management (SCM) is the coordination of all activities involved in producing and delivering a product or service, from raw materials to final delivery to the customer. It includes logistics, transportation, warehousing, and supplier coordination.
Key Components
- Supply Chain Flow: Suppliers provide materials to manufacturers, who produce goods and pass them to distributors, then retailers, and finally to customers.
- Logistics: The process of handling the transportation and storage of goods.
Example: A bakery sources flour from Supplier A → bakery produces bread → delivers to retail stores via logistics partner.
Tools & Use: SAP SCM Module (Track inventory, manage suppliers, forecast demand. Example: Input supplier info → system predicts weekly flour needs → automatically generates purchase order), Excel (Build simple supply chain tracker → delivery dates, stock levels), ERP Systems (Oracle, NetSuite) (Integrate procurement, production, distribution).
6.2 Inventory Management
Inventory management ensures that a company has the right products, in the right quantity, at the right time, without overstocking or stockouts.
Key Concepts
- EOQ (Economic Order Quantity): Optimal order quantity to minimize total inventory costs.
Example: A coffee shop uses about 100 kg of coffee beans each month. By applying the EOQ model, the business can determine an appropriate order quantity—such as 120 kg per order—to balance ordering, storage, and shortage-related costs. - Safety Stock: Extra stock to prevent shortages due to demand fluctuations.
- Lean Manufacturing Principles: Minimize waste, just-in-time inventory.
Tools & Use: SAP Inventory Module (Track stock levels, reorder alerts), Excel (EOQ formula: EOQ = √(2DS/H) where D represents demand, S is the cost of placing an order, and H is the cost of holding inventory). Example: D=1000 units/year, S=$50/order, H=$2/unit → EOQ = √(2100050/2) = 224 units.
6.3 Quality Management
Quality management ensures products/services meet customer expectations and compliance standards through systematic monitoring and improvement.
Key Methodologies
- Quality Control (QC): Inspecting products to detect defects. Example: Randomly check 50 bags of coffee beans per batch → reject defective bags.
- Six Sigma: Data-driven approach to reduce process variation and defects. Example: Reduce packaging defects from 5% → target 1% using DMAIC (Define, Measure, Analyze, Improve, Control).
Tools and uses: Minitab and JMP are used for statistical quality analysis and process control charts, Microsoft Excel is used to create defect tracking sheets and calculate defect rates, and Lean Six Sigma is used for workflow mapping to eliminate waste.
6.4 Procurement
Procurement – The systematic process of finding suppliers, negotiating terms, and acquiring the goods or services an organization needs to operate effectively.
Key Steps
- Vendor Identification: Choose suppliers based on price, quality, reliability.
- Negotiation and Contracting: Agree on pricing, delivery conditions, and quality standards.
- Purchase order and delivery tracking: ensure that goods are received on time.
Example: Bakery procures coffee beans → compares 3 suppliers → negotiates price and delivery schedule → issues PO → tracks delivery in SAP.
Tools & Uses: SAP Ariba and Oracle Procurement Cloud can streamline vendor management, purchase orders, and approval workflows. Excel can be used to compare suppliers based on factors such as pricing, delivery lead time, and vendor ratings.
6.5 Operations Risk Management
Operations risk management is the process of identifying, assessing, and mitigating risks in operations to prevent disruptions.
Key Steps
- Risk Identification: Supply delays, production errors, inventory shortages.
- Risk Assessment: Probability × Impact analysis.
- Mitigation Strategies: Diversify suppliers, maintain safety stock, adopt process controls.
Example: Risk: Supplier delay → Mitigation: Maintain 2 backup suppliers and 1-month safety stock.
Tools & Uses: An Excel risk matrix can help assess risks by comparing their likelihood and potential impact, making it easier to prioritize them. SAP’s risk-management tools can support ongoing risk tracking, monitoring, and automated alerts.
6.6 Operations Tools & Certifications
Tools
- SAP ERP / SAP SCM: Complete supply chain, inventory, procurement, and operations management. Example: Generate inventory report → forecast demand → automatic PO creation.
- Oracle ERP: Integrates finance, procurement, and supply chain data for operations insights.
- Excel: Budgeting, inventory management, risk analysis, EOQ calculation.
- Power BI / Tableau: Visualize operations KPIs, inventory trends, supplier performance.
Certifications
- APICS CSCP (Certified Supply Chain Professional): Supply chain strategy, design, operations.
- Six Sigma Green Belt: Process improvement, quality management, defect reduction.
Practical Example Using Tools
Bakery uses SAP SCM → tracks flour inventory → forecasts next month demand → creates automated purchase order. Uses Power BI to visualize sales trends and inventory gaps, helping set appropriate reorder levels. Implements Six Sigma Green Belt methods → reduces packaging defects from 5% to 1%.
This approach connects theory, practical tools, and real-world examples so you can apply operations management concepts directly.