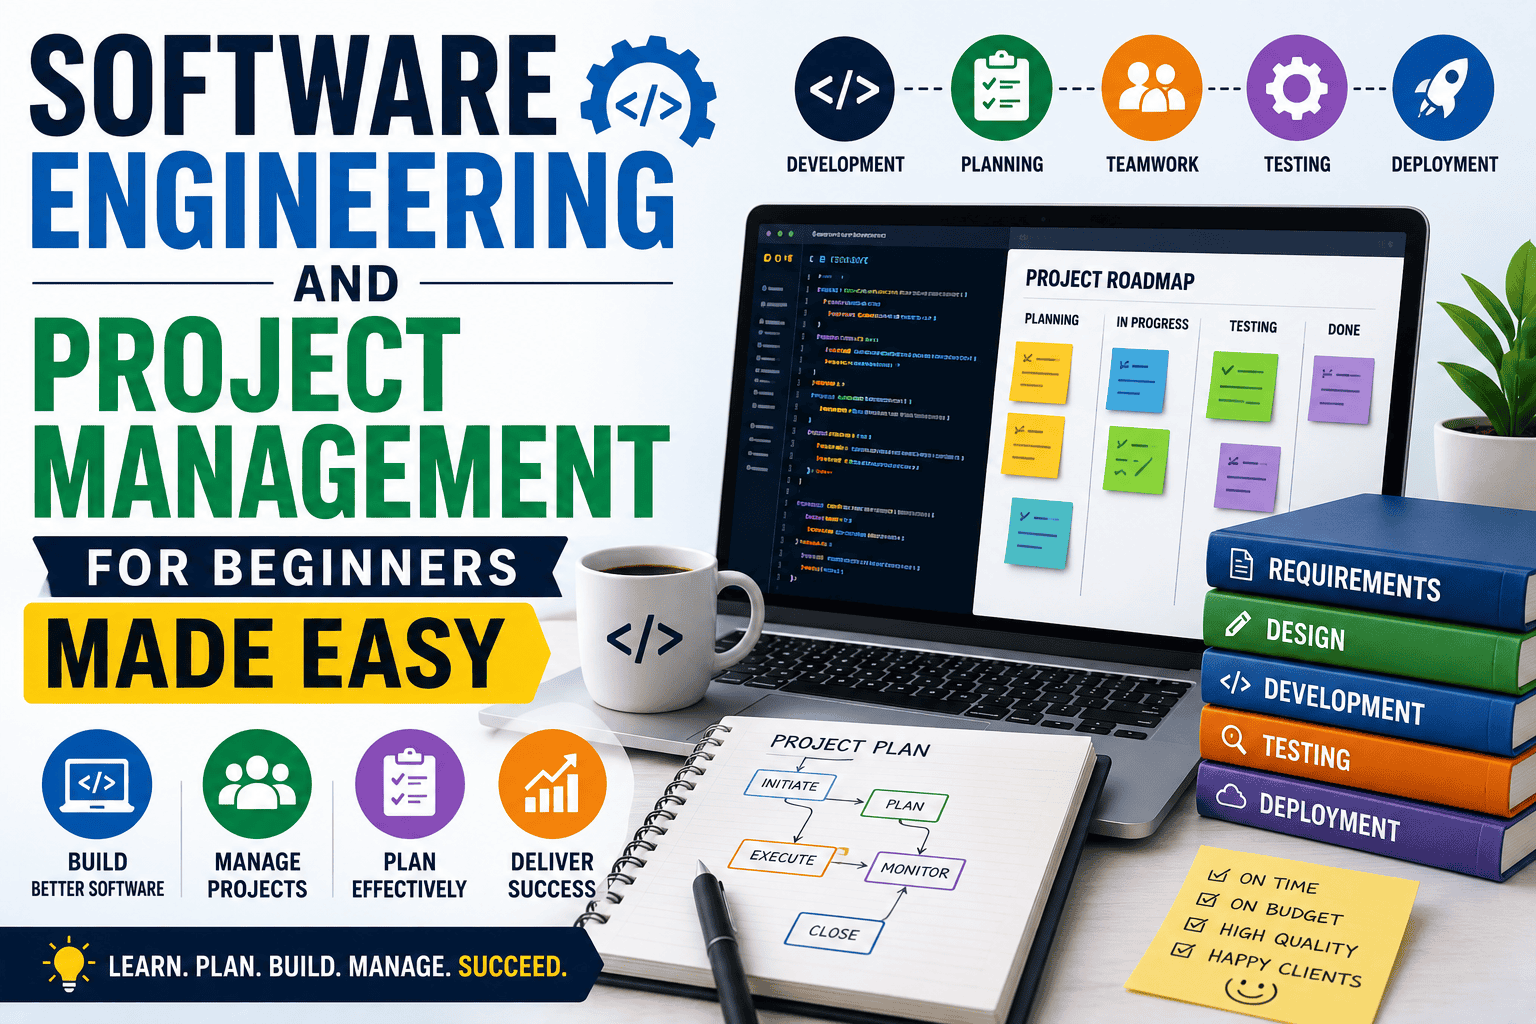
Software Engineering and Project Management
Understand How Successful Software Projects Are Planned, Built, and Delivered — Software Engineering and Project Management focuses on the methods and practices used to develop software systematically while balancing quality, schedules, resources, and changing requirements. It covers essential concepts such as the software development life cycle, requirements analysis, version control, software testing, and development approaches including Agile and Scrum. These practices help technical teams stay organized, collaborate effectively, and respond to changes throughout the development process.
This field also examines how software engineers, project managers, and other stakeholders work together to transform ideas and requirements into reliable, scalable software products. It addresses practical challenges such as managing risks, controlling technical debt, meeting deadlines, allocating resources, and adapting to changing priorities. At its core, Software Engineering and Project Management explores how complex software initiatives can be planned, coordinated, developed, and delivered in a structured and dependable manner.
- 1. SOFTWARE ENGINEERING FUNDAMENTALS
- 2. SOFTWARE DEVELOPMENT LIFECYCLE (SDLC)
- 3. SYSTEM DESIGN
- 4. PROGRAMMING PARADIGMS & SOFTWARE TESTING
- 5. PROJECT MANAGEMENT FOUNDATION
- 6. STAKEHOLDER & RISK MANAGEMENT
- 7. AGILE & SCRUM METHODOLOGY
- 8. SOFTWARE PROJECT MANAGEMENT (SPM)
- 9. PROJECT MONITORING & CLOSURE
- 10. DIGITAL TRANSFORMATION
- 11. PROFESSIONAL TOOLS MASTERY
- 12. PROFESSIONAL CERTIFICATIONS & CAREER PATHWAYS
1. SOFTWARE ENGINEERING FUNDAMENTALS
Software Engineering is the systematic process of designing, developing, testing, and maintaining software using structured methods and tools. Instead of randomly writing code, engineers follow engineering principles.
1.1. Requirements Engineering
Requirements Engineering is the process of understanding what the client or user actually needs before writing any code. It identifies the core problem that the software is designed to address. If this step is wrong, the entire project fails.
Requirements engineering includes Requirement Analysis, Problem Definition, Feasibility Study, SRS Documentation, and Requirements Gathering Techniques. It serves as a link between business requirements and technical execution.
Example: Client says “I want an online store.” The engineer converts that into clear technical requirements: users must create accounts, add products to cart, and checkout using a payment gateway.
1.1.1. Requirement Analysis (Functional & Non‑Functional)
Requirement Analysis means studying and breaking down the client’s needs into clear software features. It answers what the system must do, what constraints exist, and what quality requirements exist.
| Type | What it describes | Example (E‑commerce) |
|---|---|---|
| Functional Requirements | What the system must do (behaviours, features) | User registration, login, product search, add to cart, checkout, payment processing, order tracking, admin product management. Example: “Users should be able to select products and place them in their shopping cart.” |
| Non‑Functional Requirements | How well the system should operate (quality attributes) | Performance: load within 2 seconds; Security: passwords encrypted; Scalability: support 10,000 concurrent users; Reliability, Usability. |
Tools for Requirement Analysis: Notion, Jira, Confluence, Google Docs, Microsoft Word, Miro.
Jira (professional tool): A project management and requirement tracking tool widely used in software development. It helps manage requirements, tasks, bugs, and development workflow.
Setup: Go to atlassian.com → create account → create new project → select Software Development template. Then create Epics, Stories, Tasks. Example: Epic = “E‑commerce platform”, Story = “User registration feature”, Task = “Create registration API”.
1.1.2. Problem Statement (Five W’s Framework)
Before designing software, engineers must clearly define the problem. A popular technique is the Five W’s Framework: Who, What, When, Where, Why.
Example – E‑commerce website:
| Question | Answer |
|---|---|
| Who | Who will use the system? Customers, store admin, warehouse team. |
| What | What problem are we solving? Customers need an online platform to purchase products. |
| When | When will the system be used? 24/7 online shopping. |
| Where | Where will the system operate? Web platform accessible globally. |
| Why | Why is the system needed? To increase sales and expand business digitally. |
Tool – Miro (problem mapping): Go to miro.com → create new board → create five sections (Who, What, When, Where, Why) → write answers. This gives clarity before development.
1.1.3. Feasibility Study
Feasibility Study determines whether the project is possible and worth building. It analyses risks before development starts. Four main feasibility types:
| Type | Question | Example |
|---|---|---|
| Technical Feasibility | Does the team have the required technology, tools, and expertise to develop the software? | Can Magento support required features? Do we have Python + ML for AI recommendations? |
| Financial Feasibility | Is the project financially viable? | Development cost $20,000, expected yearly revenue $150,000 → viable. |
| Operational Feasibility | Can the organisation operate the system? | Do employees know how to use the admin dashboard? If not → training required. |
| Legal Feasibility | Does the system comply with laws and regulations? | GDPR compliance, data privacy laws, PCI‑DSS for payment security. |
Tool – Excel feasibility matrix: Columns: Technical Risk, Cost, Operational Complexity, Legal Constraints. Score each factor (Low/Medium/High). Decide project viability based on the overall assessment.
1.1.4. SRS Documentation
SRS (Software Requirements Specification) is the most important document in software engineering. It describes everything the system must do. Developers use it as a blueprint for coding.
A typical SRS includes sections such as Introduction, System Overview, Functional Requirements, Non-Functional Requirements, System Architecture, User Interface Requirements, Database Design, and Constraints and Assumptions.
Example – E‑commerce SRS:
- Functional Requirements: FR1: User registration, FR2: Product search, FR3: Shopping cart, FR4: Payment gateway integration.
- Non‑Functional Requirements: System response time < 2 seconds.
Tools: Google Docs (real‑time collaboration), Confluence (professional engineering teams).
Setup (Confluence): Create workspace → create page → add SRS template → share with developers, designers, and managers.
1.1.5. Requirements Gathering Techniques
Requirements must be collected from stakeholders. Software engineers use several techniques:
| Technique | Description | Tool / Example |
|---|---|---|
| Interviews | Direct discussion with client/stakeholders | Zoom / Google Meet. Example questions: “What features do you want? What payment methods should be supported?” |
| Surveys | Used when many users are involved | Use Google Forms to survey e-commerce customers about their preferred payment methods. |
| Observation | Observe how users perform tasks | Hotjar tracks user behaviour (heatmaps show clicks, scrolls, drop‑offs). |
Real example – Magento e‑commerce requirement:
Client request: “I want an online store.”
Requirements engineer converts it into:
- Functional: product catalog, user accounts, checkout system, payment integration, order tracking.
- Non‑functional: page load under 2 seconds, secure payment, mobile responsive design.
Tools used: Miro → problem analysis, Jira → requirement tracking, Google Docs → SRS, Hotjar → user behaviour analysis.
Why requirements engineering matters: If requirements are unclear, developers build the wrong system. Example: client wanted a subscription checkout, developer built a one‑time purchase system → huge rework cost.
1.2. Process Modeling
Process Modeling is the technique used by software engineers to visually represent how a system works before it is built. Rather than relying solely on text, engineers use diagrams and visual flows to illustrate system steps, data movement, decision points, and user interactions. This helps developers, designers, and business stakeholders understand the system clearly.
1.2.1. Flowcharts
A Flowchart is a diagram that shows the step‑by‑step flow of a process using symbols and arrows. It answers: what happens first → what happens next → what decision occurs → what action is taken.
Common flowchart symbols: Start/End (Oval), Process (Rectangle), Decision (Diamond), Input/Output (Parallelogram), Flowline (Arrow).
Example – Login process for e‑commerce website:
        (Start)
           ↓
Enter username and password
           ↓
   Validate credentials
           ↓
   Are credentials correct?
        ↓         ↓
       YES        NO
        ↓         ↓
  Login successful  Error message
        ↓         ↓
    Dashboard      Return to login
        ↓
        (End)
Tool – Draw.io (diagrams.net) – free:
Go to diagrams.net → choose storage (Google Drive or local) → Create New Diagram → Select Flowchart template. Drag shapes: Start (Oval), Process (Rectangle), Decision (Diamond), End (Oval). Connect them with arrows.
Alternative tool – Miro (collaborative): Create board → search Flowchart template → team members can collaborate in real time.
Why flowcharts matter: They help in understanding system logic, identifying logical errors, explaining system behaviour to non‑technical stakeholders, and designing algorithms before coding.
1.2.2. Data Flow Diagrams (DFD)
A Data Flow Diagram illustrates how data flows within a system. While flowcharts focus on process steps, DFDs focus on data input, data storage, data processing, and data output.
Key components of DFD:
| Component | Description | Symbol |
|---|---|---|
| External Entity | Outside user interacting with the system (Customer, Restaurant) | Square |
| Process | System activity that transforms data (Order Processing, Payment Verification) | Circle |
| Data Store | Database or storage (Customer database) | Two parallel lines |
| Data Flow | Movement of data between components (Order details, Payment information) | Arrow |
Example – Food delivery app (Level 0 DFD – simple overview):
Customer → sends order request → Food Delivery System → sends order confirmation → Restaurant.
Level 1 DFD (detailed): Customer places order → system stores order in database → payment gateway verifies payment → restaurant prepares food → system assigns delivery driver → driver delivers food to customer.
Tools for creating DFD:
- Lucidchart (free account): New Diagram → Data Flow Diagram Template. Drag elements (Square, Circle, Parallel lines, Arrows) and connect.
- Microsoft Visio (enterprise): File → New → Data Flow Diagram.
Importance of process modeling:
- Visualisation – makes complex systems easier to understand.
- Communication – helps communication between developers, managers, designers, and clients. Non‑technical stakeholders can understand diagrams easily.
- Analysis – engineers can analyse system efficiency, identify too many data transfers, redundant processes, or performance bottlenecks, then optimise the design.
1.3. Competitive Analysis (Software Perspective)
Competitive analysis helps software teams understand competing products before building a system. It answers: what features competitors provide, what customers expect, and where market gaps exist.
1.3.1. Competitor Identification
| Type | Definition | Example (Food Delivery App) |
|---|---|---|
| Direct Competitors | Products solving the same problem | Uber Eats, DoorDash, Foodpanda |
| Indirect Competitors | Different solution for the same problem | Restaurant takeaway apps |
Tools: Google Search (search “top food delivery apps” to make a competitor list), Crunchbase (shows startup competitors and funding information).
1.3.2. Feature Comparison
Engineers analyse competitor features.
| Feature | Uber Eats | DoorDash | Our App |
|---|---|---|---|
| Live Tracking | Yes | Yes | Yes |
| Wallet Payment | Yes | No | Yes |
| Subscription | Yes | Yes | Yes |
| AI Recommendations | No | No | Yes |
Tool – Excel: Create a spreadsheet with columns: Competitor, Feature List, Strength, Weakness. Compare systematically.
1.3.3. Pricing Analysis
Pricing strategy strongly affects product success.
| Platform | Delivery Fee | Commission |
|---|---|---|
| Uber Eats | $3 | 30% |
| DoorDash | $2.5 | 25% |
| Our App | $2 | 20% |
Tool – Google Sheets: Track competitor pricing. Use formulas to calculate averages.
1.3.4. SWOT Analysis
SWOT helps analyse competitive position: Strengths, Weaknesses, Opportunities, Threats.
Example – New food delivery app:
| Strengths | Weaknesses |
|---|---|
| Lower delivery fees | Small delivery network |
| Opportunities | Threats |
| Growing online food ordering market | Strong competitors like Uber Eats |
Tool – Miro: Use SWOT template. Write ideas in four quadrants.
1.3.5. Competitive Advantage
Competitive advantage is a unique benefit that competitors cannot easily copy. Examples: faster delivery, lower pricing, better AI recommendations, better customer experience.
Example strategy: A food delivery app offers AI‑based meal recommendations, real‑time driver tracking, and lower commission for restaurants – this creates differentiation.
2. SOFTWARE DEVELOPMENT LIFECYCLE (SDLC)
2.1. SDLC Overview
Software Development Lifecycle (SDLC) is a structured process used by software engineers to plan, design, develop, test, deploy, and maintain software systems. Instead of randomly writing code, engineers follow a systematic lifecycle to ensure high quality, lower risk, predictable timelines, and efficient team collaboration.
Think of SDLC like building a house. You don’t start with bricks immediately. You first understand requirements, design architecture, build structure, test safety, deliver the house, and maintain it.
Main SDLC phases (common to most models):
- Requirement Analysis
- System Design
- Development (Coding)
- Testing
- Deployment
- Maintenance
SDLC basic diagram:
Requirements
     ↓
System Design
     ↓
Development
     ↓
Testing
     ↓
Deployment
     ↓
Maintenance
Example (E‑commerce system):
Requirement → online store needed. Design → database, UI, APIs. Development → Magento customisation. Testing → checkout & payment testing. Deployment → launch store. Maintenance → bug fixes & upgrades.
2.2. SDLC Models
Different projects use different development approaches.
2.2.1. Waterfall Model
Waterfall is a linear development approach where each phase must be completed before the next phase begins. Work flows downward like a waterfall.
Requirements
     ↓
System Design
     ↓
Implementation
     ↓
Testing
     ↓
Deployment
     ↓
Maintenance
Example – Government software system (national tax management system):
Requirement phase → government defines rules. Design → architecture created. Development → programmers build system. Testing → security & functionality tested. Deployment → system launched. Changes are difficult later.
Advantages: simple to manage, clear documentation, good for stable requirements.
Disadvantages: difficult to change requirements, late testing, risk of building the wrong product.
Tools: Microsoft Project (install, create project timeline, add tasks like Requirements, Design, Development – manage phases sequentially).
2.2.2. Iterative Model
Iterative builds software through repeated cycles (iterations). Instead of building the full system at once, developers build small versions and improve them continuously.
Iteration 1 → Basic System
        ↓
Iteration 2 → Add Features
        ↓
Iteration 3 → Improve System
        ↓
Iteration 4 → Final Product
Example – E‑commerce website:
Iteration 1: basic store, product listing, simple checkout.
Iteration 2: user accounts, reviews, coupons.
Iteration 3: recommendation engine, analytics dashboard.
Advantages: faster feedback, continuous improvement, reduced risk.
Tools: Jira (create project, create tasks, assign tasks to iterations).
2.2.3. Spiral Model
Spiral integrates iterative development with continuous risk evaluation. Each iteration consists of four key phases: planning, risk assessment, development, and evaluation.Used for large complex systems.
Planning
   ↓
Risk Analysis
   ↓
Development
   ↓
Testing
   ↓
Next Spiral Iteration
Example – Banking system: requires security analysis, risk mitigation, compliance testing. Each development cycle evaluates risk.
Advantages: excellent for high‑risk systems, continuous risk evaluation, flexible design.
Disadvantages: complex management, expensive.
Tools: Risk management tools (Excel risk matrix: Risk | Probability | Impact | Mitigation). Example: Payment security risk → High → add encryption.
2.2.4. Agile Model
Agile is a modern development approach where software is built in small increments with frequent feedback. Instead of long development cycles, Agile uses short development periods called sprints (usually 1–4 weeks).
Plan
 ↓
Design
 ↓
Develop
 ↓
Test
 ↓
Release
 ↓
Feedback
 ↓
Next Sprint
Example – Food delivery app:
Sprint 1: user login, restaurant listing.
Sprint 2: cart system, payment integration.
Sprint 3: live tracking, notifications. Each sprint releases working software.
2.2.4.1. Scrum
Scrum is an Agile framework where teams work in short sprints (usually 2 weeks). Roles include: Product Owner, Scrum Master, Development Team.
Product Backlog
      ↓
Sprint Planning
      ↓
Sprint (2 weeks)
      ↓
Daily Standup
      ↓
Sprint Review
      ↓
Sprint Retrospective
Tools – Jira (most popular): Create Scrum project → add backlog tasks → plan sprint → track sprint progress. Example tasks: Login API, Checkout feature, Payment integration.
2.2.4.2. Extreme Programming (XP)
XP focuses on high‑quality code and continuous improvement. Practices include pair programming, continuous testing, and frequent releases.
Example: Two developers work together – one writes code, the other reviews it in real time. This reduces bugs.
Tools: GitHub, GitLab, Jenkins (support continuous development).
2.2.5. DevOps Model
DevOps integrates development and operations teams. Goal: automate development, testing, deployment, and monitoring.
Plan
 ↓
Code
 ↓
Build
 ↓
Test
 ↓
Release
 ↓
Deploy
 ↓
Operate
 ↓
Monitor
DevOps pipeline: Developers write code → automatically tested → automatically deployed. Reduces manual work.
Example – E‑commerce website deployment: Developer updates checkout code → DevOps pipeline automatically builds code, runs tests, deploys to server. All automated.
DevOps tools:
- Git – version control. Example commands:
git commit,git push. - Jenkins – automation server for CI/CD. Setup: install Jenkins → connect Git repository → configure build pipeline. Every code update triggers an automatic build.
- Docker – creates containerised applications. Example: a Magento store packaged into a Docker container ensures consistent deployment.
2.2.6. Model Comparison
| Model | Best For |
|---|---|
| Waterfall | Stable projects |
| Iterative | Continuous improvements |
| Spiral | High‑risk systems |
| Agile | Modern software development |
| DevOps | Automated deployment |
Real industry practice: Modern companies usually combine Agile + DevOps. Workflow: Agile sprints → feature development, DevOps pipeline → automated deployment. This enables fast and reliable software delivery.
3. SYSTEM DESIGN
System Design is the process of defining the architecture, components, interfaces, and data flow of a software system before coding begins. It transforms requirements into technical structure – like architectural blueprints before constructing a building. Without system design, code becomes messy, the system becomes hard to scale, and maintenance becomes difficult.
System design involves object-oriented analysis and design, UML modeling, and the application of established design patterns.
3.1. OOAD (Object‑Oriented Analysis & Design)
OOAD is a methodology used to design software systems using objects and classes. Instead of thinking in functions, we think in real‑world objects.
Example objects in an E‑commerce system: User, Product, Order, Cart, Payment. Each object contains properties (data) and methods (behaviour).
Example – E‑commerce object model:
- User: properties (userID, name, email); methods (login(), logout(), placeOrder())
- Product: properties (productID, price, description); methods (updatePrice(), checkStock())
- Order: properties (orderID, orderDate, totalPrice); methods (calculateTotal(), processPayment())
Tools for OOAD: Lucidchart, Draw.io, Visual Paradigm, StarUML.
Example tool setup – Draw.io: Open diagrams.net → create new diagram → select UML diagram template → add class boxes → fill class name, attributes, methods. Now your object design becomes visual.
3.2. UML Diagrams
UML (Unified Modeling Language) is a standardized way to visualise software systems. It provides different diagrams to represent system structure and behaviour.
UML diagrams are categorized into structural and behavioral types.
3.2.1. Structural UML Diagrams (show static structure)
| Diagram | Description | Example (E‑commerce) |
|---|---|---|
| Class Diagram | Shows classes, attributes, methods, relationships | User ──places── Order ──contains── Product |
| Object Diagram | Shows instances of classes at runtime | User1: User(name=Ahmed), Order1: Order(orderID=1021, total=$120) |
| Component Diagram | Shows software modules and dependencies | [Web App] → [API Server] → [Database] |
| Deployment Diagram | Shows physical infrastructure | User Browser → Web Server → Application Server → Database Server |
Example – E‑commerce class diagram (text representation):
+-----------+      places      +-----------+
|   User    | ----------------> |   Order   |
+-----------+                   +-----------+
| userID    |                   | orderID   |
| name      |                   | total     |
| email     |                   +-----------+
+-----------+                   | process() |
| login()   |                   +-----------+
| logout()  |                        |
+-----------+                        | contains
                                     v
                               +-----------+
                               |  Product  |
                               +-----------+
                               | productID |
                               | price     |
                               +-----------+
                               | update()  |
                               +-----------+
3.2.2. Behavioral UML Diagrams (show how system behaves)
| Diagram | Description | Example |
|---|---|---|
| Use Case Diagram | System functionality from user’s perspective | Customer: browse products, add to cart, place order, make payment. Admin: create and modify products, as well as oversee and manage customer orders. |
| Sequence Diagram | Order of interactions between objects | Customer → Website : Browse Product → Website → Database : Fetch Product → Database → Website : Product Data → etc. |
| Activity Diagram | Workflow of activities | Start → Select Product → Add to Cart → Checkout → Payment → Order Confirmation → End. |
| State Machine Diagram | Different states of an object | Order states: Created → Payment Pending → Payment Completed → Shipped → Delivered. |
Tools for UML diagrams: Lucidchart, Draw.io, StarUML, Visual Paradigm, PlantUML.
Example tool setup – StarUML: Download StarUML → install → create new project → add UML diagram → create class, sequence, or component diagrams.
3.3. Design Patterns
Design patterns are proven, reusable approaches for solving frequently encountered software design problems. Instead of reinventing solutions, developers follow proven patterns. They are divided into three categories.
3.3.1. Creational Design Patterns (control object creation)
| Pattern | Description | Example |
|---|---|---|
| Singleton | Ensures only one instance of a class is created and provides a global point of access | Database connection. Code: Database.getInstance() |
| Factory | Creates objects without specifying the exact class | Payment system: PaymentFactory decides which object (CreditCard, PayPal, Stripe) to create. |
Singleton pseudocode (Java‑like):
class Database {
    private static Database instance;
    private Database(){}
public static Database create Instance() {        if (instance == null) instance = new Database();
        return instance;
    }
}
3.3.2. Structural Design Patterns (focus on class relationships)
| Pattern | Description | Example |
|---|---|---|
| Adapter | Allows incompatible systems to work together | Old payment API + new checkout system – adapter converts the interface. |
| Proxy | Controls access to an object | Lazy loading images in e‑commerce – proxy loads the image only when needed. |
3.3.3. Behavioral Design Patterns (control object interaction)
| Pattern | Description | Example |
|---|---|---|
| Observer | One object must notify many others | Notification system: product price change → notify all subscribers. |
| Strategy | Allows selecting an algorithm at runtime | Checkout: payment method (Credit Card, PayPal, Crypto) chosen dynamically. |
Tools for learning design patterns: Refactoring Guru, UML Tools, GitHub code examples.
3.4. Additional Design Artifacts
These artifacts focus on how users interact with software. Even if the backend architecture is perfect, software will fail if users cannot understand the interface, navigation is confusing, or actions are difficult.
3.4.1. HCI (Human–Computer Interaction)
HCI is the study and design of how humans interact with computer systems. It focuses on making systems easy to use, efficient, intuitive, and accessible. HCI combines computer science, psychology, design, and cognitive science.
Example – food delivery app:
- Bad HCI: too many buttons, confusing checkout, difficult navigation.
- Good HCI: clear menu, simple checkout, easy navigation.
HCI interaction model:
User Action → User Interface → System Processing → System Response → User Feedback.
For example, when a user clicks “Add to Cart,” the system processes the request, updates the cart, and then displays a confirmation to the user.
Goals of HCI: usability, efficiency, accessibility, satisfaction.
Tools for HCI design: Figma, Adobe XD, Sketch, Balsamiq, InVision.
Tool setup example – Figma: go to figma.com → create account → click New Design File → add frames for screens (Login, Product, Checkout). Simulate user interaction before development.
3.4.2. UI (User Interface) & UX (User Experience)
User Interface (UI) is the visual layout through which users interact with software – buttons, forms, menus, icons, colours, typography. UI focuses on appearance and layout.
Example – E‑commerce UI (text representation):
+--------------------------------+
| LOGO        SEARCH        🛒   |
+--------------------------------+
| Categories Menu                |
+--------------------------------+
|        Product Image          |
|        Product Name           |
|        Price                  |
|      [ Add to Cart ]          |
+--------------------------------+
User Experience (UX) focuses on the overall experience users have when interacting with software – usability, efficiency, user satisfaction, workflow.
Example: Website A checkout requires 8 steps; Website B requires 2 steps. Website B provides better UX.
UX flow example (E‑commerce):
Home Page → Browse Products → View Product → Add to Cart → Checkout → Payment → Order Confirmation.
UX principles: simplicity, clarity, efficiency, accessibility. Example: Amazon uses one‑click checkout for better UX.
3.4.3. Usability Principles
| Principle | Description | Example |
|---|---|---|
| Learnability | Users should quickly learn how to use the system | New user understands navigation easily. |
| Efficiency | Experienced users should complete tasks quickly | Search bar returns results instantly. |
| Consistency | Interface elements should behave similarly | All buttons follow the same colour and style. |
| Feedback | System must respond to user actions | After clicking Submit, show a success message. |
| Error Prevention | System should prevent user mistakes | Password validation before submission. |
Usability flow: User Action → System Response → Feedback Message → Next Step.
Example: User clicks checkout → system verifies payment → system shows success message.
3.4.4. Wireframing
Wireframing is the process of creating a blueprint of a user interface before designing the final UI. Wireframes focus on layout, content placement, and navigation structure – not on colours or graphics. Think of a wireframe as the skeleton of the interface.
Example – E‑commerce homepage wireframe (text):
+----------------------------------+
| Logo        Search        Cart    |
+----------------------------------+
| Navigation Menu                  |
+----------------------------------+
|             Banner               |
+----------------------------------+
|           Product Grid            |
| [Product]  [Product]  [Product] |
+----------------------------------+
|              Footer              |
+----------------------------------+
Login page wireframe example:
+-----------------------------+
|            Logo             |
+-----------------------------+
| Email Input                |
| Password Input             |
|                             |
|        Login Button         |
+-----------------------------+
| Forgot Password Link        |
+-----------------------------+
Wireframing tools: Figma, Balsamiq, Adobe XD, Sketch, Draw.io.
Example tool setup – Balsamiq: Install Balsamiq Wireframes → create new project → drag components (text fields, buttons, menus, images) → arrange layout.
Difference between UI, UX, and Wireframe:
| Concept | Focus |
|---|---|
| HCI | Human interaction with the system |
| UI | Visual interface |
| UX | User experience |
| Wireframe | Interface blueprint |
Real industry workflow:
Requirements → User Research → Wireframes → UI Design → Prototype → Development. This ensures software is user‑friendly before coding begins.
4. PROGRAMMING PARADIGMS & SOFTWARE TESTING
Programming paradigms define how software is structured and how programmers think while writing code. The main paradigms include Object-Oriented Programming (OOP) and Functional Programming (FP). Languages like Java, Python, C, and JavaScript support these paradigms.
4.1. Object‑Oriented Programming (OOP)
OOP is a programming paradigm where software is built using objects and classes. Objects represent real‑world entities.Each object contains attributes (data) as well as methods (functions).
Example (E‑commerce system): Real‑world objects: User, Product, Cart, Order.
Example Product object: attributes (productID, name, price), methods (addToCart(), updatePrice()).
OOP class diagram (text):
Class: Product
-------------------------
productID
name
price
-------------------------
updatePrice()
addToCart()
4.1.1. Four Core Principles of OOP
| Principle | Description | Example (Java‑like pseudocode) |
|---|---|---|
| Encapsulation | Hiding internal data and exposing only necessary methods | class BankAccount { private double balance; public void deposit(double amount){ balance += amount; } } |
| Inheritance | One class inherits properties from another | class Customer extends User { int loyaltyPoints; } |
| Polymorphism | Same method behaves differently for different objects | class CreditCard extends Payment { void pay(){ print("Credit Card Payment"); } } |
| Abstraction | Hiding complexity and exposing only essential functionality | User clicks “Pay”; system handles payment processing internally. |
4.1.2. OOP Languages
| Language | Characteristics | Example |
|---|---|---|
| Java | Strong OOP, used for enterprise software, Android apps, backend systems | class Product { String name; double price; } |
| Python | Supports OOP + functional programming | class Product: def __init__(self,name,price): self.name = name; self.price = price |
| JavaScript | Used for web development | class Product { constructor(name, price){ this.name = name; this.price = price } } |
| C | Mainly procedural | #include <stdio.h> int main() { printf("Hello World"); } |
Tools for programming: VS Code, IntelliJ IDEA, PyCharm, Eclipse, Git.
Tool setup example (VS Code): Download VS Code → install extensions (Python Extension, Java Extension Pack, C/C++ Extension) → create project folder (e.g., Ecommerce‑App with product.py, order.py, user.py).
4.2. Functional Programming
Functional Programming is a paradigm where software is built using pure functions and immutable data. A function accepts input, returns an output, and does not produce side effects.
Example in JavaScript:
function add(a,b){
   return a+b
}
console.log(add(2,3)) // 5
4.2.1. Key Concepts & Languages
| Concept | Description | Example |
|---|---|---|
| Pure Functions | Output depends only on input | add(2,3) = 5 |
| Immutability | Data cannot be changed; new data is created instead | |
| Higher‑order functions | Functions that take other functions as parameters | numbers.map(x => x * 2) |
Languages popular for functional programming: Python, JavaScript, Scala, Haskell.
Functional style in Python:
numbers = [1,2,3,4]
result = list(map(lambda x: x*2, numbers))
print(result)  # Output: [2,4,6,8]
4.2.2. OOP vs Functional Programming
| Feature | OOP | Functional |
|---|---|---|
| Focus | Objects | Functions |
| Data | Mutable | Immutable |
| Structure | Classes | Functions |
Modern systems often combine OOP + functional programming.
4.3. Software Testing
Software Testing is the process of verifying that software works correctly and meets requirements.Testing ensures that functionality works as intended, identifies bugs, and maintains system reliability. Without testing, software will contain serious defects.
4.3.1. Testing Levels (Unit, Integration, Regression)
| Level | Description | Example |
|---|---|---|
| Unit Testing | Tests individual components or functions | Testing calculateTotal() function in cart. assert add(2,3) == 5 |
| Integration Testing | Verifies multiple components working together | E‑commerce checkout process: Cart → Payment → Order – all modules must integrate correctly. If payment fails, order should not be created. |
| Regression Testing | Ensures new code does not break existing functionality | Developer updates checkout feature → regression test ensures Login, Cart, and Orders still work. |
4.3.2. Testing Tools (Selenium, JUnit, Postman)
| Tool | Purpose | Example |
|---|---|---|
| Selenium | Automated browser testing (simulates real user actions) | driver = webdriver.Chrome(); driver.get("https://example.com") |
| JUnit | Java testing framework | @Test public void testAdd(){ assertEquals(5, add(2,3)); } |
| Postman | API testing | Send GET /api/products request → verify response: {"product": "Laptop", "price": 1200} |
Postman setup: Download Postman → create new request → enter API URL → send request.
4.4. Software Documentation
Documentation is essential for maintaining and using software.
| Document | Purpose | Example topics |
|---|---|---|
| User Manual | Explains how to operate the software | Installation steps, login process, feature explanation. |
| User Guide | Explains how to accomplish tasks | How to place an order, how to update a profile, how to track a shipment. |
| Test Cases | Describe test scenarios | Test Case: “Login with valid password” → Expected Result: Login success.“Entering an incorrect password displays an appropriate error message.” |
| Bug Report | Describe software defects | Title: “Checkout button not working”. Steps to reproduce: 1. Add product to cart 2. Click checkout. Expected result: Checkout page opens. Actual result: Nothing happens. |
5. PROJECT MANAGEMENT FOUNDATION
5.1. Project Management Basics & Triple Constraint
Project Management is the process of planning, organising, and controlling resources to achieve a specific goal within a defined time and budget. A project has three main characteristics: temporary (has start and end), unique output, and defined objectives. Example projects: building an E‑commerce website, developing a mobile banking app.
Triple Constraint (Project Management Triangle): Scope, Time, Cost. Quality depends on balancing these three.
        Scope
         ▲
        / \
       /   \
      /     \
    Time --- Cost
Example – E‑commerce website project:
Original plan: Scope (basic store features), Time (3 months), Cost ($20,000).
- If scope increases (client requests AI recommendations) → Time increases OR Cost increases.
- If deadline shortens to 1 month → options: increase developers (cost ↑) OR reduce features (scope ↓).
Tools for managing triple constraint: Excel, Gantt charts, Microsoft Project, Jira, Trello, Asana, Monday.com.
Example tool setup (Trello): Create account → new project board → lists: To Do, In Progress, Testing, Completed. Add tasks: design homepage, develop cart system, integrate payment gateway.
5.2. Project Life Cycle (Initiation → Closure)
Every project follows structured phases:
Initiation
    ↓
Planning
    ↓
Execution
    ↓
Monitoring
    ↓
Closure| Phase | Description | Key activities | Example output |
|---|---|---|---|
| Initiation | Defines the project idea and determines whether to begin | Identify problem, define objectives, evaluate feasibility, identify stakeholders | Project Charter (goal, budget estimate, timeline, stakeholders) |
| Planning | Defines how the project will be executed | Define scope, schedule tasks, allocate resources, risk management, communication plan | Gantt Chart, Work Breakdown Structure (WBS) |
| Execution | Actual work is performed | Frontend development, backend development, payment integration, API development | Working software modules |
| Monitoring & Controlling | Ensures the project stays within its planned timeline, scope, and budget. | Track progress, risk management, performance measurement, resolve issues | Tools like Jira dashboards and Microsoft Project are used for tracking progress. |
| Closure | Project completed and delivered | Final delivery, documentation, stakeholder approval, project review | Production server deployment, user manual, support plan |
Tools used in each phase:
- Planning: Gantt Chart, WBS.
- Execution: Slack, Jira, GitHub, Notion.
- Monitoring: Jira, MS Project, Power BI, Excel reports.
- Closure: final software, documentation, user manual.
5.3. Project Management Methodologies
5.3.1. Waterfall Methodology
Waterfall is a traditional project management methodology where the project progresses sequentially through fixed phases. Each stage must be finished before moving on. Very little flexibility for changes.
Requirements
     ↓
System Design
     ↓
Development
     ↓
Testing
     ↓
Deployment
     ↓
Maintenance
Example – Government software system (national tax system):
Step 1 – Requirements: define tax calculation rules, reporting requirements.
Step 2 – Design: database structure, application architecture.
Step 3 – Development: coding tax calculation engine.
Step 4 – Testing: test calculation accuracy, security, performance.
Step 5 – Deployment: release the system to production servers.
Step 6 – Maintenance: bug fixes and improvements.
Advantages: clear structure, strong documentation, easy project tracking.
Disadvantages: difficult to change requirements, feedback late, risk of building wrong product.
Tools: Microsoft Project, Excel planning sheets, Gantt charts.
5.3.2. Agile Methodology
Agile is a modern project management methodology where development occurs in small iterative cycles called sprints (1–4 weeks). Instead of delivering the entire system at once, Agile delivers working features gradually.
Product Backlog
      ↓
Sprint Planning
      ↓
Sprint Development
      ↓
Testing
      ↓
Release
      ↓
User Feedback
      ↓
Next Sprint
Example – E‑commerce application (sprints):
Sprint 1: user registration, login system.
Sprint 2: product catalog, product search.
Sprint 3: cart system, checkout process.
Sprint 4: payment integration, order tracking.
After every sprint, users test the system and provide feedback.
Agile team structure: Product Owner, Scrum Master, Development Team.
Advantages: flexible requirements, faster delivery, continuous feedback, higher customer satisfaction.
Disadvantages: difficult for large rigid projects, requires strong team collaboration, less documentation.
Tools: Jira, Trello, Asana, Monday.com.
5.3.3. Waterfall vs Agile
| Feature | Waterfall | Agile |
|---|---|---|
| Development Approach | Sequential | Iterative |
| Flexibility | Low | High |
| Customer Feedback | Late | Continuous |
| Documentation | Extensive | Moderate |
| Risk | Higher if requirements change | Lower due to feedback |
| Best For | Stable projects | Dynamic projects |
Example – E‑commerce project comparison:
- Waterfall: full system built first → then delivered. Risk: if checkout process is bad, changes are expensive.
- Agile: checkout feature built early → user feedback improves system → better user experience.
Modern industry practice: Most modern companies combine Agile + DevOps. Workflow: Agile sprint development → continuous integration → automated testing → continuous deployment.
5.4. Project Initiation
5.4.1. Project Goals & SMART Goals
Project goals are clear statements describing what the project aims to achieve. They align the team and stakeholders and provide direction.
Example (software project): Goal: develop a secure e‑commerce web application with payment gateway integration.
SMART goals:
- Specific: build a platform for online shopping.
- Measurable: launch MVP in 4 months.
- Achievable: team of 5 developers and 2 testers.
- Relevant: supports company expansion strategy.
- Time‑bound: MVP ready by August 2026.
Tools: Trello / Jira (track goal milestones), Miro / Lucidchart (visual diagrams to map goals and dependencies).
5.4.2. Business Case & Project Charter
Business case justifies the project, highlighting benefits, ROI, and risks. It helps stakeholders approve and fund the project.
Example:
- Problem: existing website crashes under traffic.
- Solution: new scalable e‑commerce system.
- Benefits: increase sales by 30%, reduce downtime, improve user experience.
- Costs: $50k development, $5k/month maintenance.
- ROI: expected breakeven in 1 year.
Tools: MS Word / Google Docs (formal business case), Excel / Google Sheets (cost‑benefit analysis).
Project Charter formally authorises the project and defines objectives, scope, and stakeholders.
| Component | Description |
|---|---|
| Project Purpose | Build a secure e‑commerce web app |
| Deliverables | Web app, Admin Panel, Payment Integration |
| Timeline | 4 months |
| Stakeholders | CEO, Product Owner, Development Team |
| Approval | Signed by Project Sponsor |
Tools: MS Word / Google Docs, Jira / Confluence (store digital charter and track updates).
5.4.3. Stakeholder Identification
Stakeholder identification identifies all people/groups impacted by the project. Purpose: ensure engagement and manage expectations.
Stakeholder types: Internal (Developers, QA, Management), External (Clients, End‑users, Vendors).
Tools: Stakeholder Matrix (visual chart categorising stakeholders by interest and influence).
Power‑Interest grid:
- High Influence, High Interest → Manage Closely
- High Influence, Low Interest → Keep Satisfied
- Low Influence, High Interest → Keep Informed
- Low Influence, Low Interest → Monitor
5.5. Project Planning
5.5.1. Scope Definition & Project Plan
Scope definition clearly defines what is part of the project and what is not included. It prevents scope creep and sets clear deliverables.
Example (software):
- In Scope: user authentication, product catalog, payment integration.
- Out of Scope: mobile app (separate project), advanced analytics.
Tools: MS Project / Jira Epics & Stories (define tasks and sprints), Lucidchart (scope diagrams).
Project plan is a roadmap of activities, timelines, dependencies, and resources.
Tool – Gantt Chart in MS Project, Jira / ClickUp / Asana (Kanban and sprint planning).
5.5.2. Budget Baseline & Roles (RACI)
Budget baseline is the approved budget against which actual costs are tracked.
| Category | Planned Cost |
|---|---|
| Development | $30,000 |
| Testing | $10,000 |
| Deployment | $5,000 |
| Contingency | $5,000 |
Tools: Excel / Google Sheets (track planned vs actual), QuickBooks / Zoho Books (real‑time financial tracking).
Roles & Responsibilities – RACI Matrix:
| Task | Responsible | Accountable | Consulted | Informed |
|---|---|---|---|---|
| Requirement Gathering | BA | PM | Client | Team |
| Development | Dev Team | Tech Lead | QA | PM |
| Testing | QA Team | QA Lead | Dev Team | PM |
Tools: Excel / Google Sheets, Jira / Asana (assign tasks and owners).
5.6. Project Execution
5.6.1. Resource Allocation & Management
Resource allocation assigns personnel, tools, and budget to tasks. Example: Developer A → Backend, Developer B → Frontend, QA → Test Automation.
Tools: MS Project Resource Sheet, Smartsheet / Jira (track assignments and workload).
Resource management monitors and optimises resource usage. Techniques: resource leveling (avoid overloading), resource smoothing (adjust tasks to match availability).
Tools: MS Project (resource allocation charts), Trello / Asana (visual task assignment).
5.6.2. Progress Meetings & Issue Resolution
Progress meetings review progress, blockers, and next steps. Types: Daily Standups (Agile), Weekly Status Meetings, Retrospectives.
Tools: Zoom / Teams (video meetings), Jira / ClickUp (progress dashboards).
Issue resolution identifies, tracks, and resolves project issues. Example: Issue: API integration failing. Resolution: developer investigates logs, fixes endpoint, QA verifies.
Tools: Jira / GitHub Issues (track issues and status), Slack / Teams (communication).
5.7. Project Governance & Compliance
Compliance ensures the project follows organisational policies, standards, and regulations. Examples: ISO 9001 standards, GDPR compliance for data privacy.
Governance structures provide a framework to manage decision‑making, authority, and reporting. Example structure: Project Sponsor → Project Steering Committee → Project Manager → Team Leads → Developers/QA.
Tools: Confluence / SharePoint (documentation), Audit Logs (track compliance), RACI Matrix (define governance roles), MS Project / Jira (track approvals and decisions).
5.8. MS Project Practical Application
Project name: E‑Commerce Web App
Start date: 1st April 2026
Working hours: 7 hours/day, 35 hours/week
5.8.1. Work Breakdown Structure (WBS) and Gantt Chart
| WBS ID | Task Name | Duration | Predecessor | Resource |
|---|---|---|---|---|
| 1 | Inception Phase | 5 days | PM, BA | |
| 1.1 | Requirement Analysis | 3 days | BA | |
| 1.2 | Stakeholder Approval | 2 days | 1.1 | PM |
| 2 | Delivery Phase | 20 days | 1.2 | Dev Team |
| 2.1 | Frontend Development | 10 days | 1.2 | Dev A |
| 2.2 | Backend Development | 10 days | 1.2 | Dev B |
| 2.3 | Testing | 5 days | 2.1,2.2 | QA Team |
| 2.4 | Deployment | 2 days | 2.3 | Dev Team |
| 3 | Post‑Project Phase | 5 days | 2.4 | PM, BA |
| 3.1 | Documentation | 2 days | 2.4 | BA |
| 3.2 | Maintenance Handover | 3 days | 3.1 | Dev Team |
| M1 | Milestone: Project Kickoff | 0 days | PM | |
| M2 | Milestone: Beta Release | 0 days | 2.3 | PM |
| M3 | Milestone: Project Closure | 0 days | 3.2 | PM |
Gantt Chart visualisation (text):
Week:     1     2     3     4     5
Inception Phase ████
 Req Analysis    ███
 Stakeholder Appr     ██
Delivery Phase          █████████████████
 Frontend Dev            ██████
 Backend Dev             ██████
 Testing                        ████
 Deployment                           ██
Post-Project Phase                               █████
 Documentation                                  ██
 Maintenance Handover                             ███
Milestones: Kickoff ◆ Beta Release       ◆ Project Closure ◆
Critical path: Inception → Delivery → Post‑Project.
Task dependencies: Most tasks follow a Finish-to-Start (FS) relationship. Frontend and backend development proceed in parallel using a Start-to-Start (SS) relationship, while testing begins after both development tasks are completed.
5.8.2. Resource Sheet & Baseline Setting
| Resource Name | Type | Max Units | Standard Rate | Notes |
|---|---|---|---|---|
| PM | Work | 100% | $50/hr | Project Management |
| BA | Work | 100% | $40/hr | Requirement Analysis |
| Dev A | Work | 100% | $45/hr | Frontend Development |
| Dev B | Work | 100% | $45/hr | Backend Development |
| QA Team | Work | 100% | $35/hr | Testing |
Baseline setting: Project → Set Baseline → Entire Project. Compare baseline vs actual in Tracking Gantt. Benefit: monitor deviations in schedule and costs.
Timescale & Gantt chart settings: Timescale: Weeks / Months; display milestones as diamonds; display critical path in red bars; optionally colour‑code by phase.
Key PM features used: WBS (organise tasks hierarchically), task dependencies (manage order of execution), milestones (track key events), resource assignment (allocate team efficiently), baseline (track deviations), Gantt chart (visualise schedule).
Practical tip in MS Project: Use Task → Link Tasks to set dependencies. Resource → Assign Resources to avoid overallocation. View → Gantt Chart → Timescale → Weeks/Months for better visualisation.
6. STAKEHOLDER & RISK MANAGEMENT
6.1. Stakeholder Analysis & Strategy
Stakeholder Analysis identifies all individuals, groups, or organisations affected by or having an interest in a project. It helps in managing expectations and communication effectively.
Steps: Identification (list all stakeholders), Categorisation (group by role, influence, or interest), Power/Interest Grid (plot stakeholders to prioritise engagement).
Power/Interest Grid categories:
| Category | Action Strategy |
|---|---|
| Stakeholders with high power and high interest. | Manage closely by providing regular updates. |
| Stakeholders with high power but low interest. | Keep satisfied through periodic reporting. |
| Low Power, High Interest | Keep Informed – newsletters, updates |
| Low Power, Low Interest | Monitor – minimal effort |
Example (software project):
| Stakeholder | Power | Interest | Category | Engagement Strategy |
|---|---|---|---|---|
| CEO | High | High | Manage Closely | Weekly review meetings |
| Product Owner | High | Low | Keep Satisfied | Bi‑weekly reports |
| End Users | Low | High | Keep Informed | Surveys, newsletters |
| Vendor | Low | Low | Monitor | Email updates only |
Tools include Microsoft Excel or Google Sheets for creating a stakeholder matrix, and Miro or Lucidchart for designing a visual grid diagram.
Stakeholder strategy – expectation management: Align project deliverables with stakeholder expectations. Avoid scope creep and dissatisfaction.
Communication planning: Determine who, what, when, and how to communicate. Format: meetings, emails, reports, dashboards.
| Stakeholder | Communication Type | Frequency | Owner |
|---|---|---|---|
| CEO | Status Report | Weekly | PM |
| End Users | Product Demo | Monthly | BA |
| Team Leads | Scrum Meeting | Daily | Scrum Master |
Tools: MS Project / Jira (share dashboards), Teams / Slack / Zoom (communication), Confluence / Notion (central documentation).
6.2. Risk Management Process
Risk Management identifies, assesses, and prioritises risks to minimise negative impact on the project.
Steps:
- Risk Identification – brainstorm potential risks affecting schedule, cost, scope, quality. Example (software project): server downtime, developer attrition, third‑party API failure.
- Qualitative Analysis – assess likelihood and impact using a risk matrix.
| Likelihood | Impact | Risk Level |
|---|---|---|
| High | High | Critical |
| High | Low | Medium |
| Low | High | Medium |
| Low | Low | Low |
- Quantitative Analysis – use numerical methods to estimate cost/time impact. Example: delay of 3 days × $500/day = $1,500 potential cost.
- Mitigation Strategy – prevent or reduce the risk. Examples: backup servers (reduce downtime risk), code review and testing (reduce defect risk).
Tools: Risk Register in Excel / Smartsheet (track risks), MS Project (assign contingency tasks), RISKAMP / Primavera (advanced risk analysis).
6.3. Contingency Planning
Contingency planning prepares backup plans and resources to handle identified risks.
Key elements:
- Budgeting for risks: allocate contingency funds (e.g., 10% of project budget).
- Risk response strategies:
| Strategy | Description | Example |
|---|---|---|
| Avoid | Change plan to remove risk | Switch to a reliable API |
| Mitigate | Reduce probability/impact | Add automated testing |
| Transfer | Shift risk to third‑party | Outsource server hosting |
| Accept | Recognise risk and plan for it | Minor delays accepted |
Tools: MS Project (assign contingency tasks), Excel / Google Sheets (track budgets).
Example: Risk = server downtime. Response: use cloud hosting with SLA + contingency budget $1,000/month.
7. AGILE & SCRUM METHODOLOGY
7.1. Agile Principles
Agile is a flexible, iterative approach to project management and software development, emphasising collaboration, customer feedback, and adaptability.
Agile Values (from the Agile Manifesto):
- Individuals & interactions over processes and tools
- Working software over comprehensive documentation
- Customer collaboration over contract negotiation
- Responding to change over following a plan
Agile Principles: deliver working software frequently (weeks rather than months), welcome changing requirements, close daily collaboration, motivated individuals, self‑organising teams, continuous attention to technical excellence.
Tools: Jira / ClickUp (track iterations), Trello / Asana (Agile boards), Confluence / Notion (documentation).
7.2. Scrum Framework (Roles, Events, Artifacts)
Scrum is an Agile framework to develop complex projects in iterative cycles called sprints.
Scrum Roles:
| Role | Responsibility |
|---|---|
| Product Owner | Defines features, manages product backlog, prioritises tasks |
| Scrum Master | Facilitates Scrum process, removes blockers, ensures rules are followed |
| Development Team | Cross‑functional team building the product |
Scrum Events:
| Event | Description | Duration / Frequency |
|---|---|---|
| Sprint Planning | Plan tasks for the upcoming sprint | 2‑4 hours for a 2‑week sprint |
| Daily Stand‑ups | Provide brief updates on progress and highlight any blockers. | Held daily for 15 minutes. |
| Sprint Review | Demonstrate completed work to stakeholders | 1‑2 hours at sprint end |
| Sprint Retrospective | Review process & improve team performance | 1‑2 hours at sprint end |
Scrum Artifacts:
| Artifact | Definition | Example in software project |
|---|---|---|
| Product Backlog | Ordered list of features, fixes | Login feature, payment integration |
| Sprint Backlog | Tasks selected for the current sprint | Implement login UI, backend API |
| Increment | Working, tested software at sprint end | Completed login functionality |
Tools: Jira is used for managing backlogs and sprint boards, while Trello supports Kanban-style task and sprint management.
7.3. Kanban & Scaled Agile (SAFe)
Kanban is a visual method for managing workflow that emphasises continuous delivery and limiting work in progress (WIP). Key principles: show the workflow visually (To Do → In Progress → Done), limit WIP, continuous delivery.
Example board (text):
Tasks are organized into three stages—To Do, In Progress, and Done—with Task 1 and Task 4 in To Do, Task 2 and Task 5 in Progress, and Task 3 and Task 6 completed.
Tools: Trello / Jira (Kanban boards), LeanKit (advanced Kanban tracking).
Scaled Agile (SAFe) implements Agile practices across large organisations by coordinating multiple teams. Core layers: Team Level (Scrum/Kanban), Program Level (Agile Release Trains – ARTs), Portfolio Level (strategic alignment & budgeting).
Tools: Jira Align / Rally (enterprise Agile tracking), MS Project / Azure DevOps (portfolio visibility).
7.4. Agile Certifications
| Certification | Provider | Focus Area |
|---|---|---|
| CSM (Certified Scrum Master) | Scrum Alliance | Scrum Master role & Scrum framework |
| CSD (Certified Scrum Developer) | Scrum Alliance | Agile development practices, TDD, CI |
| SAFe Certification | Scaled Agile Inc | Implementing SAFe at enterprise scale |
Study resources: Scrum Guide (official), SAFe website (enterprise Agile resources), Jira / Trello practice (hands‑on Agile implementation).
8. SOFTWARE PROJECT MANAGEMENT (SPM)
8.1. Agile SPM & DevOps / CI/CD
Agile SPM applies Agile practices to software projects, emphasizing iterative delivery, collaboration, adaptability, and ongoing customer feedback. Practices: iterative planning (sprints 2–4 weeks), incremental delivery (working software each sprint), backlog management, daily Scrum meetings.
Example sprint goal: Implement user login + authentication. Sprint backlog: frontend login page, backend authentication API, database integration.
Tools: Jira, Trello, ClickUp (backlog and sprint tracking).
DevOps and CI/CD integrate development and operations to automate processes such as deployment, testing, and delivery.
| Area | Tool / Example | Purpose |
|---|---|---|
| Continuous Integration (CI) | Tools such as Jenkins and GitLab CI are commonly used for continuous integration and delivery. | Enables automated builds and unit testing. |
| Continuous Deployment (CD) | Jenkins, GitLab, GitHub Actions | Automatic deployment to staging/production |
| Version Control | Git, GitHub, Bitbucket | Track code changes & collaboration |
| Monitoring | Prometheus, Grafana | System performance monitoring |
Example workflow: Developer commits code → GitHub → CI server (Jenkins) runs tests → on success, CD deploys to staging → QA tests, then deploys to production.
8.2. Effort Estimation (COCOMO, Function Points)
COCOMO (Constructive Cost Model): Effort = a × (KLOC)^b (person‑months), where KLOC = thousand lines of code.
Function Point Analysis (FPA): estimates effort based on functionality delivered (inputs, outputs, user interactions, files).
Example: small web app → 10 KLOC → Effort = 2.4 × (10)^1.05 ≈ 28 person‑months.
Tools: Excel, specialised estimation software.
8.3. Software Project Management Metrics and Risk Management
| Metric | Description | Tool |
|---|---|---|
| Velocity | Work completed per sprint (story points) | Jira / ClickUp |
| Defect Density | Bugs per KLOC | Bugzilla |
| Schedule Variance (SV) | Planned vs actual schedule | MS Project |
| Budget Variance (BV) | Planned vs actual cost | Excel / Jira |
| Team Productivity | Tasks completed per developer | Jira / ClickUp |
Risk management in software: recognises possible technical issues early and takes steps to reduce them. Common technical risks: low‑quality code (mitigation: code reviews, unit testing), technology changes (feasibility analysis, training), infrastructure failure (cloud redundancy, monitoring).
Mitigation strategy: maintain a risk register, allocate contingency resources, regular risk review meetings.
8.4. Development Tools & Software Architecture
| Category | Tools / Example | Purpose |
|---|---|---|
| Version Control | Git, GitHub, Bitbucket | Track code, collaborate |
| Collaboration | Confluence, Slack | Documentation & communication |
| IDE | IntelliJ IDEA | Efficient coding & debugging |
| Containerisation | Docker, Kubernetes | Environment consistency, scaling |
| AI Assistance | GitHub Copilot | AI‑driven code suggestions |
Software architecture types:
- Monolithic Architecture: single codebase, tightly coupled modules. Easier for small projects, harder to scale.
- Microservices Architecture: independent services communicate via REST APIs. Scalable, easier maintenance, cloud‑native.
- Cloud‑Native: built for cloud deployment (AWS, Azure, GCP). Uses containers, auto‑scaling, microservices.
8.5. Emerging Trends & Certifications
| Trend | Description |
|---|---|
| AI and machine learning applied to software development. | AI-powered tools are used to generate code and identify potential bugs. |
| Cybersecurity Integration | Embed security in SDLC (DevSecOps) |
| Cloud‑native & Serverless | Apps built for cloud with scalability |
| Automated Testing & CI/CD | Faster, reliable deployments |
Software certifications:
| Certification | Provider | Focus Area |
|---|---|---|
| AWS Certified Developer | Amazon Web Services | Cloud‑native app development, deployment |
| UML Certification | OMG / Enterprise | Software modelling, architecture documentation |
| PMP / Agile Certified | PMI / Scrum Alliance | Project management & Agile practices |
9. PROJECT MONITORING & CLOSURE
9.1. Performance Tracking (KPIs, EVM)
Project Monitoring tracks project progress and performance against the plan to ensure objectives are met.
| KPI | Description | Example (Software Project) |
|---|---|---|
| Schedule Variance (SV) | Planned vs actual schedule | Planned 20 days, actual 22 days → SV = -2 |
| Cost Variance (CV) | Planned vs actual cost | Planned $50k, actual $52k → CV = -$2k |
| Scope Completion | % of tasks completed vs planned | 45/50 tasks → 90% complete |
| Defect Density | Bugs per KLOC | 5 bugs per 1000 LOC |
| Team Velocity | Work completed per sprint (story points) | 30 story points per sprint |
Earned Value Management (EVM) combines scope, schedule, and cost to assess performance.
Example metrics: Planned Value (PV) = $50k, Earned Value (EV) = $45k, Actual Cost (AC) = $52k.
- SV = EV – PV = -$5k → behind schedule.
- CV = EV – AC = -$7k → over budget.
Tools: MS Project (Gantt charts, baseline comparison, EVM analysis), Jira / ClickUp (sprint progress, velocity), Power BI / Tableau (dashboard visualisation).
9.2. Project Evaluation & Documentation
Project evaluation measures outcomes to determine success and capture lessons for future projects.
Methods:
- Post‑Mortem Analysis: analyse what went well, what went wrong, document lessons learned. Example: sprint delays due to unclear requirements → improve backlog refinement.
- Earned Value Management (EVM) as above.
Documentation is the organised recording of all project knowledge, decisions, and processes. Types:
- Knowledge Management: lessons learned, best practices.
- Project documentation includes requirements documents, architecture diagrams, test plans and reports, and deployment guides.
Tools: Confluence / Notion (central knowledge repository), Google Drive / SharePoint (shared document storage).
9.3. Communication & Conflict Resolution
Effective communication ensures clarity, transparency, and stakeholder engagement. Practices: regular status reports, dashboards, emails or meetings based on stakeholder interest.
Conflict resolution: identify disputes (e.g., scope disagreements), use negotiation or mediation, document decisions.
Stakeholder negotiation: balance project constraints (time, cost, scope) with stakeholder expectations. Example: stakeholder requests an additional feature → evaluate cost/time, negotiate the timeline.
Tools: Slack / Teams (team communication), Zoom / Google Meet (stakeholder meetings), Jira / MS Project (status updates).
10. DIGITAL TRANSFORMATION
10.1. AI in Business & Automation
AI in business leverages algorithms and machine learning to automate tasks, predict trends, and improve decision‑making.
| Application | Example / Tool |
|---|---|
| Customer Service Automation | Chatbots (IBM Watson Assistant, ChatGPT) |
| Recommendation Systems | Amazon or Netflix product suggestions |
| Predictive Analytics | Sales forecasting using AI models |
Example: predictive analytics predicts a 20% increase in demand next month → adjust inventory accordingly.
Automation uses technology to handle repetitive tasks, making processes faster, more efficient, and less error‑prone.
| Type | Description | Tools |
|---|---|---|
| Business Process Automation (BPA) | Automates routine tasks like invoice processing | UiPath, Automation Anywhere |
| Workflow Optimisation | Streamlines task sequences for faster delivery | Zapier, Microsoft Power Automate |
Example: automatically approve purchase orders under $1,000 using a workflow bot → saves manual review time.
10.2. Digital Transformation Framework (5‑Step)
- Assess Current State – analyse existing processes, IT systems, and workforce skills.
- Define Vision – set goals like “reduce operational cost by 15% in 12 months.”
- Redesign Processes – streamline workflows using automation, AI, or cloud solutions.
- Implement Technology – deploy ERP, cloud services, AI systems, or collaboration tools.
- Train Employees – educate staff to use new systems effectively.
10.3. Cybersecurity, Cloud Computing & ERP Systems
Cybersecurity protects digital assets from threats while ensuring data privacy and compliance.
Key points: data privacy regulations (GDPR, HIPAA), security measures (firewalls, encryption, multi‑factor authentication).
Tools: Norton, CrowdStrike, AWS Security Hub.
Cloud computing delivers computing resources over the internet, enabling scalability, storage, and access from anywhere.
| Platform | Services / Use Case |
|---|---|
| AWS | EC2, S3, RDS, Lambda (serverless apps) |
| Microsoft Azure | Virtual Machines, Azure SQL, AI Services |
Example: deploy a web application on AWS → auto‑scale during high traffic periods.
ERP Systems integrate core business processes into a single system for efficiency. Components include finance, supply chain, HR, CRM.
Example: SAP or Oracle ERP connects HR, Sales, and Inventory → real‑time reporting.
10.4. Digital Transformation Tools & Certification
| Tool / Platform | Purpose |
|---|---|
| AWS / Azure | Cloud computing & hosting services |
| ERP Systems (SAP, Oracle) | Business process integration & reporting |
| Excel / Power BI | Data analysis & visualisation |
| Automation Tools | UiPath, Zapier, Power Automate |
Certification:
- Digital Transformation Certificate (universities / institutes) – AI, automation, cloud, ERP, strategy.
- AWS Certified Solutions Architect (Amazon Web Services) – cloud deployment & architecture.
- Microsoft Certified: Azure Fundamentals (Microsoft) – cloud services & digital solutions.
11. PROFESSIONAL TOOLS MASTERY
11.1. Project Management, Data & Collaboration Tools
Project Management Tools:
| Tool | Use Case / Feature | Example in Software Project |
|---|---|---|
| MS Project | Detailed scheduling, Gantt charts, baseline tracking | Planning e‑commerce project timeline |
| Jira | Agile boards, sprint planning, backlog management | Sprint tracking in Agile projects |
| Trello | Kanban‑style boards for task tracking | Organising feature development tasks |
| Asana | Task assignment, project tracking, calendar views | Managing marketing campaign tasks |
| Monday.com | Customisable workflows, visual dashboards | IT project tracking |
Data & BI Tools:
| Tool | Use Case / Example |
|---|---|
| Excel | Data analysis, pivot tables, financial modelling |
| Power BI | Interactive dashboards, real‑time business metrics |
| Tableau | Data visualisation, storytelling with charts |
| Google Data Studio | Free reporting dashboards with Google integrations |
Collaboration Tools:
| Tool | Use Case / Example |
|---|---|
| Slack | Team messaging, channels, notifications |
| Zoom | Video conferencing, webinars |
| Google Workspace | Docs, Sheets, Gmail, Drive for cloud collaboration |
| Confluence | Knowledge base, documentation |
| Notion | Notes, databases, task management |
11.2. Financial, CRM, ERP & Development Tools
Financial Tools:
| Tool | Use Case / Example |
|---|---|
| QuickBooks | Accounting, invoicing, payroll management |
| Xero | Cloud accounting, bank reconciliation |
| FreshBooks | Time tracking, invoicing, expense management |
CRM & ERP Tools:
| Tool | Use Case / Example |
|---|---|
| Salesforce | Customer data management, sales pipeline tracking |
| SAP | ERP for finance, supply chain, HR integration |
| Oracle ERP | Enterprise resource planning for large‑scale operations |
Development Tools:
| Tool | Use Case / Example |
|---|---|
| IntelliJ IDEA | Java development, code completion, debugging |
| Docker | Containerisation for consistent environments |
| Kubernetes | Orchestration of containerised applications |
| Git | Version control, track code changes |
| GitHub | Collaborative code repository, pull requests |
11.3. Marketing & HR Tools
Marketing Tools:
| Tool | Use Case / Example |
|---|---|
| Google Analytics | Website traffic analysis, user behaviour tracking |
| SEMrush | SEO analysis, competitor tracking |
| HubSpot | Marketing automation, CRM integration |
| Hootsuite | Social media management and scheduling |
HR Tools:
| Tool | Use Case / Example |
|---|---|
| SAP SuccessFactors | HR management, talent acquisition, performance management |
| Workday | Payroll, employee data management, analytics |
12. PROFESSIONAL CERTIFICATIONS & CAREER PATHWAYS
12.1. Business, Project Management & Strategy Certifications
| Certification | Focus Area | Example Use Case |
|---|---|---|
| MBA | Comprehensive business management, strategy, leadership | CEO, Operations Manager |
| Business Administration Certificate | Core business functions (HR, Finance, Marketing) | Mid‑level management roles |
| Certificate in Business Law | Covers legal frameworks, contracts, and corporate law. | Focuses on compliance and risk management. |
| Corporate Compliance Certificate | Governance, ethics, regulatory compliance | Internal audit & compliance officer |
| PMP | PMBOK‑based full project management | Senior Project Manager |
| PRINCE2 | Structured PM methodology | Government or enterprise projects |
| CSM | Scrum Master / Agile methodology | Agile teams, software development |
| SAFe | Scaled Agile for enterprise | Multi‑team Agile projects |
| Harvard Business Strategy Certificate | Strategic thinking, competitive advantage | Business Strategy Consultant |
| CMC (Certified Management Consultant) | Advisory & leadership skills | Executive advisory roles |
12.2. Quality, Finance, Marketing & HR Certifications
| Certification | Focus Area | Example Use Case |
|---|---|---|
| Six Sigma Green / Black Belt | Process improvement, quality management | Operations Manager, Process Analyst |
| APICS CSCP | Supply chain & operations | Supply Chain Manager |
| CMA | Management accounting, corporate finance | Financial Controller |
| CFA | Investment management, financial analysis | Financial Analyst |
| Google Digital Marketing Certification | SEO, SEM, analytics, digital campaigns | Digital Marketing Manager |
| HubSpot Content Marketing Certification | Content marketing, inbound strategy | Marketing Specialist |
| PHR (Professional in HR) | HR management, employee relations | HR Manager |
| SHRM‑CP | Strategic HR practices, workforce planning | HR Specialist |
12.3. Technology & Entrepreneurship Certifications
| Certification | Focus Area | Example Use Case |
|---|---|---|
| AWS Certified Developer | Cloud deployment, serverless & cloud‑native apps | Cloud Engineer |
| CSD (Certified Scrum Developer) | Agile software practices | Scrum teams |
| UML Certification | Software modelling, architecture | Software Architect |
| Digital Transformation Certificate | Strategy, AI, cloud, ERP | Digital Transformation Lead |
| MIT Entrepreneurship Program | Startup management, innovation strategy | Founder / Entrepreneur |
| Y Combinator Startup School | Lean startup, funding, scaling | Early‑stage startup founders |
12.4. Career Pathways & Mastery Implementation
Career pathways overview:
| Role | Skills Needed | Career Growth Example |
|---|---|---|
| Business Analyst | Requirements gathering, documentation, analysis | Junior → Senior BA → Product Manager |
| Operations Manager | Process optimisation, KPI management | Assistant Ops Manager → Operations Director |
| HR Manager | Recruitment, payroll, performance management | HR Executive → HR Manager → CHRO |
| Marketing Manager | SEO, digital campaigns, analytics | Marketing Executive → Manager → CMO |
| Financial Analyst | Financial modelling, valuation, reporting | Analyst → Senior Analyst → Finance Manager |
| Project Manager | Planning, execution, risk management | PM → Senior PM → Program Manager |
| Scrum Master | Agile facilitation, team coaching | Scrum Master → Agile Coach → Enterprise Agile Lead |
| Agile Coach | Organisational Agile transformation | Coach → Enterprise Agile Consultant |
| COO | Leadership, strategy, operations management | Director → VP Operations → COO |
| Entrepreneur | Business acumen, innovation, funding | Startup Founder → Serial Entrepreneur |
Mastery implementation – practical projects:
| Project Type | Description | Example Tools |
|---|---|---|
| Cross‑Functional Business Projects | Teams solving real problems | Excel, Power BI, MS Project, Jira |
| Full‑Stack Application Development | Build end‑to‑end software | IntelliJ, GitHub, Docker, Kubernetes |
| Kaggle Data Analysis Projects | Data exploration, modelling | Python, Power BI, Tableau, Excel |
| Mock Marketing Campaigns | Simulate campaigns with analytics | HubSpot, Google Analytics, Hootsuite |
Case studies: business success analysis (Amazon, Tesla), business failure analysis (Nokia, Kodak), software project failure analysis (Healthcare.gov launch).
Portfolio development: UML diagrams, project plans (Gantt charts, sprint plans), dashboards (Power BI / Tableau), code repositories (GitHub).
Professional networking: LinkedIn Groups, PMI membership, IEEE membership, Agile Alliance membership.
Finance growth plan: implement real‑world projects, track KPIs, build dashboards, connect with mentors and professionals for career growth.