Google Analytics
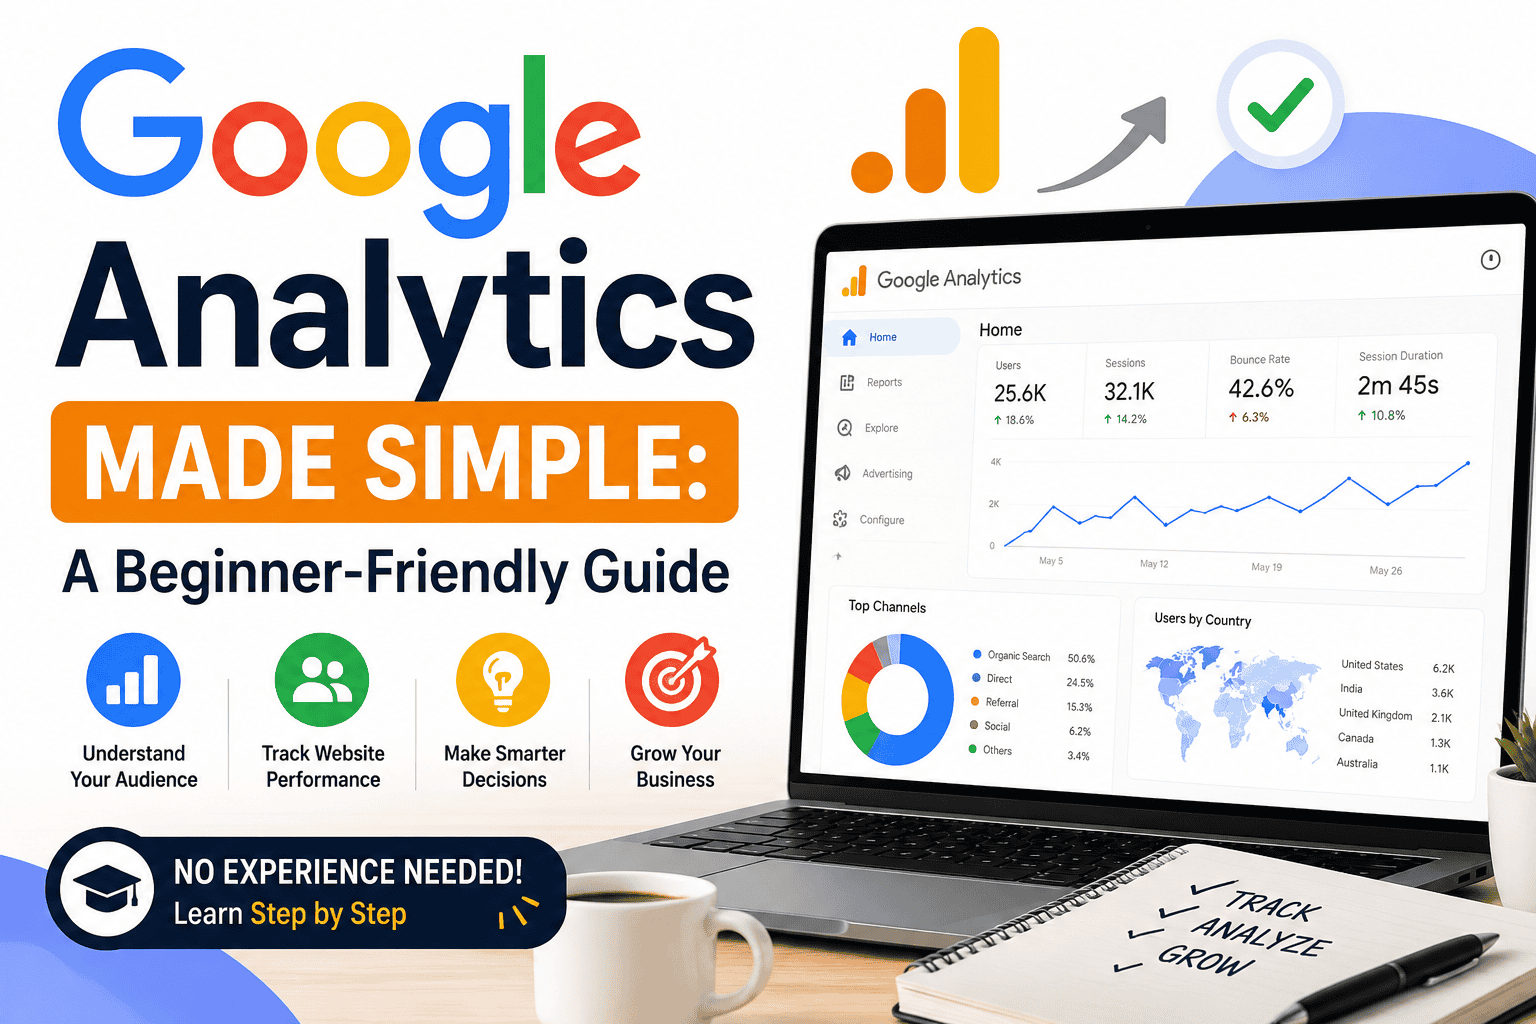
Turn website visitors into a clear, actionable story. Google Analytics is a web analytics platform that tracks and reports website and app traffic, revealing how users find, navigate, and interact with digital content. It covers core metrics like traffic sources, user behavior, conversion rates, and audience demographics, giving businesses insight into what’s working and what needs improvement. This tool blends real-time data with historical trends, helping marketers and website owners make informed decisions about content, design, and advertising strategy. At its core, Google Analytics asks how understanding user behavior can turn a website into a more effective, data-driven tool for growth.
Content Overview
- 1. Google Analytics: A Complete Guide
- 2. Introduction to Google Analytics
- 3. What Google Analytics Tracks
- 4. Complete GA Setup Process
- 5. Google Tag Manager (GTM) Deep Dive
- 6. Event Tracking in GA4
- 7. Goals, Conversions & Funnels
- 8. Important Reports in Google Analytics
- 9. Data Retention & Search Console Integration
- 10. Google Marketing Platform Organization
- 11. Integrating Google Analytics with Other Platforms
- 12. Testing & Debugging
- 13. Strategy Using Google Analytics
- 14. Final Summary & Conclusion
- 15. Troubleshooting Common Issues
- 16. Privacy and Compliance
- Appendix: Quick Reference
1. Google Analytics: A Complete Guide
Google Analytics: A widely used web analytics platform for tracking and analyzing website and user activity.. It provides businesses, marketers, and website owners with deep insights into how users interact with their websites and mobile applications. In today’s data-driven digital landscape, understanding user behavior is not optional—it is essential for survival and growth.
This comprehensive guide covers everything from the fundamentals of Google Analytics to advanced implementation techniques, reporting, and strategy. It is written for both technical and non-technical users, with clear explanations and practical examples.
2. Introduction to Google Analytics
2.1 What Google Analytics Does and Why It Matters
Google Analytics (GA) is a web analytics tool provided by Google that tracks and reports website traffic, user behavior, marketing performance, and conversions. It helps businesses and marketers understand how users interact with their website or app, enabling data-driven decision-making.
With Google Analytics, you can understand:
- Website Traffic Sources: Where your visitors come from—Organic search, Paid search (Google Ads), Direct (typed URL), Referral (other websites), Social media, Email campaigns.
- User Interactions: What users do on your site—page views, clicks, downloads, video plays, scrolls, form submissions.
- Audience Demographics: Who your users are—age, gender, location (country, city), device (desktop, mobile, tablet), browser, operating system.
- E-commerce Performance: Sales, transactions, revenue, average order value, product performance, shopping behavior.
- Conversions: Goal completions—form submissions, sign-ups, purchases, leads, downloads.
- User Journeys: The path users take through your website—landing pages, navigation paths, exit pages.
How It Works (High-Level):
- Data Collection: A small JavaScript tracking code (gtag.js or through GTM) collects data from your website.
- Data Processing: Google Analytics processes the raw data, organizes it, and aggregates it.
- Data Storage: Data is stored on Google’s secure servers.
- Data Visualization: Data is presented in reports, dashboards, and explorations.
Why It Is Essential:
Google Analytics is necessary for:
- SEO Experts: To track organic traffic, keyword performance, and user engagement.
- PPC Managers: To measure campaign performance, conversion rates, and ROI.
- Social Media Managers: To track social traffic and engagement.
- Email Marketers: To measure email-driven traffic and conversions.
- E-commerce Businesses: To track sales, revenue, and customer behavior.
- Content Creators: To understand which content performs best.
- Agencies: To provide clients with measurable results.
If you promote a website in today’s digital world, Google Analytics is not optional—it is required. It helps you:
- Measure Marketing Performance: Know what’s working and what’s not.
- Understand Audience Behavior: Know what your users want and need.
- Track Conversions: Know which actions users complete.
- Improve ROI: Allocate budgets to the most effective channels.
- Increase Revenue: Optimize user experience to drive more sales and conversions.
Example: An e-commerce store owner uses Google Analytics to discover that 60% of their traffic comes from mobile devices, but the mobile conversion rate is only 1.5% compared to 4% on desktop. This insight prompts them to optimize their mobile site, improving the mobile user experience and increasing mobile conversions to 3%.
2.2 Why Google Analytics Is Essential
Google Analytics is not optional for anyone serious about their online presence. It is the foundation of data-driven decision-making in digital marketing.
Without Google Analytics:
- You have no idea which marketing efforts are working
- You waste money on ineffective channels
- You cannot understand what your visitors actually want
- You miss opportunities to improve your website
- You cannot track growth or prove ROI
With Google Analytics:
- You see exactly which traffic sources drive the most valuable visitors
- You identify your best-performing content and products
- You discover where visitors get stuck or leave
- You track actual revenue, leads, and sign-ups
- You make decisions based on facts, not guesses
For SEO Experts:
Track organic traffic, keyword performance, and user engagement to optimize for search rankings.
For PPC Managers:
Measure campaign performance, conversion rates, and return on ad spend to allocate budgets effectively.
For Social Media Managers:
Track social traffic and engagement to refine content strategy and posting schedules.
For Email Marketers:
Measure email-driven traffic and conversions to improve newsletter performance.
For E-Commerce Businesses:
Track sales, revenue, customer behavior, and product performance to increase profitability.
For Content Creators:
Understand which content resonates most with your audience to plan future topics.
For Agencies:
Provide clients with measurable results and data-backed recommendations.
Example: A small business owner spends $1,000 per month on various marketing channels. By analyzing their Google Analytics data, they discover that one channel drives 80% of their sales while another generates almost none. They reallocate their budget to the winning channel and see a 50% increase in revenue without spending more money.
2.3 How Google Analytics Works
The story of Google Analytics does not start from its dashboard. It starts from your website. Whenever a visitor lands on your website—whether from Google organic search, social media, paid ads, or a direct URL—a small JavaScript tracking code fires inside your website. That code transmits data to Google Analytics.
Google Analytics performs three main functions:
1. Data Collection:
Data is collected from websites and apps using embedded tracking codes or through Google Tag Manager.
- Web Tracking: Uses
gtag.jstracking code or Google Tag Manager (GTM). - App Tracking: Uses Firebase SDK for mobile apps.
- What is Tracked: Pageviews, sessions, events, conversions, traffic sources, transactions, user interactions (clicks, scrolls, downloads).
2. Data Storage:
Data is stored on Google’s servers.
- Hierarchy: Account → Property → Data Stream.
- Data Retention: Default is 14 months (configurable up to 50 months).
- Data Processing: Data is processed and aggregated for reporting.
3. Data Visualization:
Data is displayed through:
- Reports: Pre-built reports (Acquisition, Behavior, Audience, Conversions).
- Dashboards: Customizable overviews.
- Explore Tab: Advanced analysis tools (Funnel Exploration, Segment Overlap, Path Analysis).
- Advertising Tab: Campaign performance and attribution.
The Tracking Process:
- User visits your website.
- The GA tracking code (or GTM) fires and collects data.
- Data is sent to Google’s servers.
- GA processes and stores the data.
- You access the data through GA reports.
Understanding how GA works helps you troubleshoot issues, interpret data correctly, and ensure accurate tracking.
Example: When you publish a new blog post and share it on social media, the GA tracking code collects data on every visitor who arrives from that social media post. You can see in Real-Time reports immediately, and within 24-48 hours, the data appears in standard reports showing traffic sources, page views, and engagement metrics.
2.4 GA Account Structure (Hierarchy)
Google Analytics follows a hierarchical structure that organizes data from the broadest level (Organization) down to the most granular (Conversions). Understanding this structure is essential for proper setup and management.
The Hierarchy (Top to Bottom):
| Level | Description | Key Details |
|---|---|---|
| Organization | Top-level container (Google Marketing Platform) | One GA account cannot belong to multiple organizations. Used by agencies and enterprises. |
| Account | Holds properties | Can hold up to 100 properties per account. A single account is usually created for a business or client. |
| Property | Represents a website or app | Each property has a unique Property ID. A single business can have multiple properties (e.g., website, mobile app, blog). |
| Data Stream (GA4) | Web, iOS, Android streams | Replaces “Views” from Universal Analytics. Each data stream represents a source of data (e.g., your website URL). |
| View (UA only) | Filtered perspective of data | Not applicable in GA4. In UA, views allowed you to create filtered subsets of data. |
| Goals / Conversions | Tracks completed actions | In UA, goals (max 20 per view). In GA4, any event can be marked as a conversion (no limit). |
Understanding the hierarchy helps you:
- Organize Multiple Websites: Manage multiple properties under one account.
- Set Proper Permissions: Grant access at the appropriate level (Account, Property, or Data Stream).
- Avoid Data Mixing: Keep data for different properties separate.
- Manage Large Organizations: Use Organizations for centralized control.
Example: A digital marketing agency manages analytics for 10 clients. They create one Organization (Agency Name), then separate Accounts for each client (Client A, Client B, etc.). Within each Account, they create Properties for each website or app. This structure keeps data organized and allows proper access control.
2.5 Versions of Google Analytics (Full History)
Google Analytics has evolved significantly since its inception. Understanding the history and differences between versions is essential for choosing the right setup.
2.5.1 Urchin (2000)
- The Original: The first web analytics software.
- Method: Server log-based tracking (analyzed server logs, not JavaScript).
- Acquisition: Acquired by Google in 2005.
- Significance: Laid the foundation for modern web analytics.
2.5.2 Google Analytics Classic (2005)
- The First Free Version: The first free, publicly available version after Google acquired Urchin.
- Method: JavaScript-based tracking (replaced server logs).
- Significance: Became the foundation for modern web analytics and made analytics accessible to everyone.
2.5.3 Universal Analytics (UA) – 2012
- Revolutionized Tracking: Significant advancement in user behavior tracking.
- Data Model: Session-based data model.
- Tracking: Uses Client ID (device-based tracking).
- Views: Introduced Views (filtered perspectives of data).
- Goals Limit: 20 Goals limit per view.
- Tracking ID Format: UA-XXXXXX-Y.
- Enhanced Ecommerce: Advanced e-commerce tracking.
- Custom Dimensions/Metrics: Allowed creation of custom dimensions and metrics.
- Status: Discontinued in July 2023 (no longer processes new data; historical data remains accessible for a limited time).
2.5.4 Google Analytics 4 (GA4) – 2020 (Current Version)
- Future-Focused: Designed for the future of analytics and privacy.
- Data Model: Event-based tracking (every interaction is an event).
- Tracking: Uses User ID (enables cross-device tracking).
- Views: No Views concept—Data Streams replace views.
- Conversions: Any event can be marked as a conversion (no arbitrary limit).
- Machine Learning: Built-in predictive analytics (churn probability, purchase probability).
- Privacy-First: GDPR-friendly, no IP storage by default.
- Cross-Platform: Integrated web + app tracking (one property for both).
- Enhanced Measurement: Automatically tracks scrolls, outbound clicks, file downloads, site search, video engagement.
- Tracking ID Format: G-XXXXXXX.
2.5.5 Switching from UA to GA4
- Upgrade Path: You can upgrade a Universal Analytics property to GA4.
- Parallel Tracking: A single property can include both UA and GA4 tracking, or they can be set up as separate properties.
- Recommendation: Google recommends maintaining both in parallel during a transition period.
- New Data: New data collection should use GA4 because UA stopped processing data from July 2023.
Importance
Understanding the differences between UA and GA4 is essential for:
- Proper Setup: Knowing which version to implement.
- Data Interpretation: Understanding why reports look different.
- Future-Proofing: Preparing for GA4 as the standard.
Example: A marketer who has been using UA for years must transition to GA4. They set up GA4 in parallel to collect data while still accessing historical UA data. They learn that GA4 reports engagement rate instead of bounce rate, and conversions are marked as events instead of goals.
2.6 UA vs GA4 – Key Differences
Universal Analytics (UA) and Google Analytics 4 (GA4) are fundamentally different in their data models, tracking methods, and features. Understanding these differences is crucial for a successful transition.
| Feature | Universal Analytics (UA) | Google Analytics 4 (GA4) |
|---|---|---|
| Data Model | Session-based (sessions and pageviews) | Event-based (every interaction is an event) |
| Tracking ID | Client ID (device-based) | User ID (cross-device) |
| Views | Yes (filtered perspectives) | No (Data Streams replace views) |
| Goals Limit | 20 per view | No limit (events marked as conversions) |
| Cross-Device Tracking | Limited | Advanced (User ID, Google Signals) |
| Machine Learning | Basic | Built-in predictions (churn, purchase probability) |
| Privacy | Less flexible, stores IP by default | Privacy-first, no IP storage by default |
| Ecommerce | Enhanced Ecommerce | Enhanced Measurement + recommended events |
| Reporting | Standard reports | More flexible, customizable reports |
| Data Retention | Indefinite (unless set) | Up to 50 months (configurable) |
| Status | Discontinued (July 2023) | Current standard |
| Integration | GA + GTM separate | GA4 + GTM integrated |
Understanding these differences helps:
- Avoid Confusion: Know why metrics like bounce rate vs. engagement rate differ.
- Proper Setup: Configure GA4 correctly based on its event-based model.
- Data Interpretation: Understand the meaning of reports and metrics.
Example: A marketer looking at UA sees “Bounce Rate” of 60%. In GA4, they see “Engagement Rate” of 40%. These are not the same metric—engagement rate measures sessions with conversions, 10+ seconds duration, or 2+ page views. The marketer learns to interpret GA4 metrics correctly.
3. What Google Analytics Tracks
3.1 Website Traffic Sources
Google Analytics shows exactly where your visitors come from. This is called traffic attribution—understanding which channels drive people to your website.
Organic Search:
Visitors who find your website through unpaid search engine results. They typed a query into Google, Bing, or another search engine and clicked on your listing.
- What it tells you: How well your SEO efforts are performing
- Why it matters: Organic traffic is free and often highly targeted
- How to improve: Create quality content, optimize for relevant keywords, build backlinks
- Example: A blog post about “best coffee beans” ranks on the first page of Google and drives 500 organic visitors per month.
Paid Search:
Visitors who arrive through paid advertising campaigns, primarily Google Ads. You pay for each click on your ad.
- What it tells you: ROI of your paid search campaigns
- Why it matters: Paid search can drive immediate, targeted traffic
- How to improve: Optimize ad copy, target relevant keywords, improve landing pages
- Example: A business spends $500 on Google Ads and generates 200 visitors and 10 sales ($1,000 revenue). The ROI is positive.
Direct Traffic:
Visitors who type your website URL directly into their browser or use a bookmarked link.
- What it tells you: Brand awareness and customer loyalty
- Why it matters: Direct traffic indicates people already know your brand
- How to improve: Build brand recognition through consistent marketing
- Example: A customer types “myfavoritecandles.com” directly into their browser.
Referral Traffic:
Visitors who arrive by clicking a link on another website. This includes blog posts, news articles, partner sites, and directories.
- What it tells you: Which external sites are sending you visitors
- Why it matters: Referrals indicate your content is valued by other publishers
- How to improve: Build relationships, guest post, get featured on industry sites
- Example: A popular food blog links to your recipe website, sending 200 visitors.
Social Traffic:
Visitors who come from social media platforms like Facebook, Instagram, LinkedIn, Twitter, TikTok, or Pinterest.
- What it tells you: Which social platforms drive the most traffic
- Why it matters: Social media can build community and brand awareness
- How to improve: Post engaging content, interact with followers, use social ads
- Example: A Facebook post about a new product drives 300 visitors to your store.
Email Traffic:
Visitors who come from links in your email campaigns, newsletters, or automated emails.
- What it tells you: Effectiveness of your email marketing
- Why it matters: Email often has high conversion rates
- How to improve: Segment your list, personalize content, optimize subject lines
- Example: A weekly newsletter sends 1,000 subscribers to your new blog post.
Affiliate Traffic:
Visitors who come from affiliate partners who promote your products or services.
- What it tells you: Performance of your affiliate program
- Why it matters: Affiliates can expand your reach without upfront costs
- How to improve: Recruit quality affiliates, provide promotional materials
- Example: An influencer shares your product link and drives 150 visitors.
Unassigned or (Other) Traffic:
Visitors that GA cannot classify into a specific source. This can include dark social, certain mobile apps, or technical limitations.
- What it tells you: There is untracked traffic
- Why it matters: May indicate missing UTM parameters or tracking gaps
- How to improve: Use UTM parameters for all campaigns
Example: A B2B software company analyzes their traffic sources. They discover that organic search drives 40% of traffic, paid search drives 25%, referrals drive 15%, social drives 10%, and direct drives 10%. They also see that organic search has the highest conversion rate. They decide to invest more in SEO and content marketing to further grow their organic traffic.
3.2 User Interactions (Events)
Beyond just counting visitors, Google Analytics tracks what visitors actually do on your website. These interactions are called events.
Page Views:
Every time a visitor loads a page on your website, it counts as a page view. This tells you which pages are most popular.
- What it tells you: Which content attracts the most attention
- Why it matters: You can identify your best-performing content
- Example: A blog sees 10,000 page views per month on their “beginner’s guide” article.
Unique Page Views:
The number of sessions that included a specific page. If a visitor views the same page multiple times in one session, it counts as one unique page view.
- What it tells you: How many distinct visitors engaged with a page
- Why it matters: Helps you understand reach, not just total views
- Example: A product page has 5,000 page views but 4,000 unique page views.
Average Time on Page:
How long visitors spend on a specific page.
- What it tells you: How effectively your content captures and maintains the audience’s interest.
- Why it matters: Longer time suggests more engaging content
- Example: A detailed tutorial has an average time on page of 4 minutes.
Bounce Rate (UA):
The percentage of visitors who leave after viewing only one page.
- What it tells you: Whether visitors find what they’re looking for
- Why it matters: High bounce rate may indicate a problem
- Note: In GA4, bounce rate is replaced by Engagement Rate.
Engagement Rate (GA4):
The percentage of sessions that lasted at least 10 seconds, had a conversion, or had at least 2 page views.
- What it tells you: How engaging your site is
- Why it matters: Better measure than bounce rate
- Example: A website has a 45% engagement rate, meaning 45% of sessions are engaged.
Clicks:
Tracked when visitors click on specific elements like buttons, links, images, or navigation items.
- What it tells you: What visitors are interested in
- Why it matters: Helps optimize user flow and conversion paths
- Example: A “Buy Now” button gets 500 clicks per month.
Downloads:
Tracked when visitors download files like PDFs, images, or software.
- What it tells you: Which resources are most valuable
- Why it matters: Shows what content your audience wants
- Example: A PDF guide is downloaded 1,000 times.
Scrolls:
Tracked when visitors scroll to specific depths (25%, 50%, 75%, 90%).
- What it tells you: How far down the page visitors read
- Why it matters: Helps optimize page length and content placement
- Example: Only 20% of visitors scroll past the first section of a page.
Video Plays:
Tracked when visitors play, pause, or complete videos.
- What it tells you: Engagement with video content
- Why it matters: Video engagement indicates deep interest
- Example: A product demo video has a 70% completion rate.
Form Submissions:
Tracked when visitors complete and submit forms (contact forms, sign-up forms, checkout).
- What it tells you: Lead generation and conversion activity
- Why it matters: Forms are often the primary conversion point
- Example: A contact form receives 50 submissions per month.
Example: An online course provider tracks clicks on their “Enroll Now” buttons. They notice that the button on the course description page gets 10x more clicks than the button on the homepage. They add the course description content to the homepage, increasing overall enrollments.
3.3 Audience Demographics
Google Analytics provides rich demographic data about your visitors, helping you understand who they are beyond just their behavior.
Age:
The age range of your visitors (18-24, 25-34, 35-44, 45-54, 55-64, 65+).
- What it tells you: The age demographic of your audience
- Why it matters: Helps tailor content and offers to specific age groups
- Example: A fashion store discovers 60% of visitors are aged 18-34.
Gender:
The gender of your visitors (Male, Female, Unknown).
- What it tells you: Gender distribution of your audience
- Why it matters: Helps customize messaging and product selection
- Example: A beauty brand discovers 80% of visitors are female.
Location:
The country, region, and city where visitors are located.
- What it tells you: Geographic distribution of your audience
- Why it matters: Helps localize content, language, and offerings
- Example: A travel agency discovers 50% of visitors are from the UK.
Language:
The language setting of the visitor’s browser.
- What it tells you: What languages your visitors speak
- Why it matters: Helps determine if you need multilingual content
- Example: A website discovers 20% of visitors speak Spanish.
Device Category:
The type of device visitors use (Desktop, Mobile, Tablet).
- What it tells you: How visitors access your site
- Why it matters: Helps optimize for mobile vs desktop
- Example: An e-commerce store discovers 70% of traffic is from mobile.
Browser:
The browser visitors use (Chrome, Safari, Firefox, Edge, etc.).
- What it tells you: Browser preferences of your audience
- Why it matters: Helps ensure compatibility and testing
- Example: 80% of visitors use Chrome.
Operating System:
The operating system of the visitor’s device (Windows, macOS, iOS, Android, etc.).
- What it tells you: OS preferences
- Why it matters: Helps optimize for different platforms
- Example: 60% of mobile visitors use iOS.
Interests (Affinity Categories):
Long-term interests of visitors based on their browsing behavior (Sports, Travel, Fashion, Technology, etc.).
- What it tells you: What your audience is interested in
- Why it matters: Helps with content creation and ad targeting
- Example: A travel blog discovers visitors are interested in “Budget Travel.”
In-Market Segments:
Visitors who are actively researching or comparing products in specific categories (Automotive, Apparel, Electronics, etc.).
- What it tells you: Who is close to making a purchase
- Why it matters: High-value audience for remarketing and ad targeting
- Example: An electronics store sees visitors in the “Electronics” in-market segment.
Example: A fashion e-commerce store analyzes their audience demographics and discovers that 65% of visitors are women aged 25-34, primarily from the United States. They also see that the “Apparel” in-market segment is the largest among visitors. They create targeted content for this group and tailor their ad campaigns to US women in that age range.
3.4 E-Commerce Performance
For online stores, Google Analytics provides detailed e-commerce tracking that goes far beyond basic sales numbers.
Revenue:
The total sales revenue generated on your website.
- What it tells you: Overall sales performance
- Why it matters: The most important metric for e-commerce
- Example: A store generates $100,000 in revenue in a month.
Transactions:
The total number of completed purchases.
- What it tells you: Sales volume
- Why it matters: Indicates conversion activity
- Example: 500 transactions are completed.
Average Order Value (AOV):
The average revenue per purchase.
- What it tells you: How much customers spend per transaction
- Why it matters: Helps optimize pricing and upselling
- Example: Average order value is $200 ($100,000 / 500).
Conversion Rate:
The percentage of visitors who complete a purchase.
- What it tells you: Effectiveness of your sales funnel
- Why it matters: Small improvements can significantly increase revenue
- Example: 2% of visitors make a purchase (500 purchases / 25,000 visitors).
Shopping Behavior Analysis:
The funnel from product view → add to cart → checkout → purchase.
- What it tells you: Where customers drop off
- Why it matters: Identifies bottlenecks in the purchasing process
- Example: 10,000 views, 2,000 add-to-cart, 500 checkout, 100 purchase.
Checkout Behavior Analysis:
Step-by-step breakdown of the checkout process.
- What it tells you: Where customers abandon their cart
- Why it matters: Helps optimize the checkout experience
- Example: 40% of cart abandonment happens at the shipping information step.
Product Performance:
Revenue, quantity sold, and conversion rate for individual products.
- What it tells you: Which products are bestsellers
- Why it matters: Helps with inventory and marketing decisions
- Example: Product A generates $50,000 in revenue (50% of total).
Product List Performance:
Performance of products in categories, search results, or recommendations.
- What it tells you: How products perform in different contexts
- Why it matters: Helps optimize product placement
- Example: Products in the “featured” section have a 5% higher conversion rate.
Coupon Code Performance:
Performance of different coupon codes.
- What it tells you: Which promotions drive the most sales
- Why it matters: Helps optimize promotional strategy
- Example: Code SAVE10 generates 200 sales; code WELCOME generates 50 sales.
Example: An e-commerce store owner analyzes their shopping behavior report and discovers that 65% of visitors add items to cart, but only 15% complete the purchase. The checkout behavior analysis shows that 40% of cart abandonment happens at the shipping information step. They simplify the shipping form and add a guest checkout option. The conversion rate increases to 25%, significantly boosting revenue.
3.5 Conversions
A conversion is any completed action that is valuable to your business. In GA4, conversions are marked events that you define as important.
Common Conversions:
- Purchase: A completed sale
- Form Submission: A contact form, quote request, or lead form
- Sign-Up: A newsletter signup, account creation, or trial start
- Download: A PDF, software, or resource download
- Phone Call: A click-to-call action
- Demo Request: A request for a product demonstration
- Appointment Booking: A scheduled meeting or consultation
- Social Share: A social media share of your content
Why Conversions Matter:
Conversions are the most important metric in Google Analytics. Traffic and engagement are meaningless without conversions. Every visitor should ideally move toward a conversion, and your website should be optimized to guide them there.
Example: A software company tracks free trial sign-ups as conversions. They notice that visitors from organic search convert at 8%, while visitors from paid ads convert at 3%. They shift more budget to SEO and optimize their paid campaigns for better quality traffic.
4. Complete GA Setup Process
4.1 Creating a Google Analytics Account (GA4)
Creating a Google Analytics account is the first step in implementing GA4. The process involves setting up an account, creating a property, and configuring a data stream.
Step 1 – Visit and Create Account:
- Go to https://analytics.google.com.
- Sign in with your Google account (Gmail or Google Workspace).
- Click Start Measuring.
- Enter an Account Name (e.g., “Your Company Name” or “Client Name”).
- Note: One account can hold up to 100 properties.
Step 2 – Create Property:
- Enter Property Name (e.g., “My Business Website”).
- Enter Website URL (e.g., https://www.yourwebsite.com).
- Select Industry Category (e.g., “Retail”, “Education”, “Technology”).
- Choose Time Zone and Currency.
- Click Create.
- A Property ID is generated automatically (e.g., 123456789).
Step 3 – Create Data Stream (GA4):
- Open the Admin section (gear icon).
- Navigate to Data Streams.
- Select Web.
- Enter your Website URL.
- Enter a Stream Name (e.g., “My Website – Production”).
- Click Create Stream.
- You will receive a Measurement ID (format
G-XXXXXXX) and the gtag.js tracking code.
Importance
Proper account setup ensures accurate data collection and organized data management.
Example: A small business owner named Sarah creates a GA4 account for her online store. She sets the account name as “Sarah’s Boutique,” creates a property called “Sarah’s Boutique Website,” and sets up a web data stream for her URL https://www.sarahsboutique.com. She receives a Measurement ID G-ABC123XYZ. She now has everything needed to start tracking.
4.2 Linking Google Analytics with Your Website
There are two primary methods to connect GA4 to your website: the Direct Manual Method and using Google Tag Manager (GTM). GTM is the recommended approach.
4.2.1 Direct Manual Method:
- Admin → Data Streams → Select your data stream.
- Copy the Global Site Tag (
gtag.js) code. - Insert the code within the
<head>section on each page of your website. - Save and verify in Real-Time reports.
For WordPress (Direct Method):
- Use a plugin like “Header Footer Code Manager” (by 99robots) — easier than editing
header.php. - Avoid heavy plugins like “Google Site Kit”; instead, use GTM4WP (explained below).
4.2.2 Google Tag Manager (GTM) – Recommended:
Why GTM Instead of Direct GA Code?
- Single Dashboard: Manage all tags (GA, Google Ads, Facebook Pixel, LinkedIn Pixel, Hotjar, Microsoft Clarity) from one interface.
- No Developer Dependency: Make changes without waiting for developers.
- Version Control: Roll back to previous versions.
- Easy Updates: Update tags without editing website code.
- Flexibility: Add custom tags and triggers easily.
Step 1 – Create a GTM Account:
- Visit https://tagmanager.google.com.
- Create a new account, such as one named “Your Company.”
- Create a container (e.g., “Your Website”).
- Choose Web as the platform.
- Copy the two code snippets provided:
<head>code – paste right after the opening<head>tag.<body>code – paste right after the opening<body>tag.
For WordPress (GTM Method):
- Install the free plugin GTM4WP.
- Go to plugin settings → paste your GTM ID – no manual code editing needed.
Importance
Using GTM is the professional standard for tracking implementation. It provides flexibility, control, and scalability.
Example: A digital marketer installs GTM on their WordPress site using the GTM4WP plugin. They paste the GTM ID and can now add GA4, Google Ads, Facebook Pixel, and Hotjar tags—all from the GTM interface—without touching the website code again.
4.3 Testing Before Publishing
Testing ensures that your tracking implementation is working correctly before making it live. This prevents data loss and ensures accurate data collection.
Step 1 – GTM Preview Mode:
- In GTM, click Preview.
- Enter your website URL.
- If it’s your first time, install the Chrome extension Tag Assistant Companion.
- Click Connect and then open your website.
- In the GTM Preview window, check that your tag (e.g., GA4 Configuration) shows Tag Fired.
Step 2 – GA4 DebugView:
- In GA4, navigate to Admin → DebugView.
- Send the
debug_modeparameter (GTM can enable it automatically). - See each event as it arrives in real-time.
Step 3 – Real-Time Reports:
- In GA4, navigate to Reports → Real-Time.
- You should see an active user and a page view registered.
Verification Checklist:
- Tag fires in GTM Preview.
- Event appears in DebugView.
- Real-Time shows active user.
- (For conversions) The event is marked as a conversion in GA4 Admin → Conversions.
Importance
Testing prevents data loss and ensures accurate tracking from the start.
Example: A marketer sets up a GA4 tag in GTM and clicks Preview. They navigate to their website and see the GA4 Configuration tag “Fired” in the preview window. They check GA4 DebugView and see the page_view event. They check Real-Time Reports and see an active user. Everything is working correctly.
4.4 Publishing Your GTM Container
Once testing is complete, you must publish your GTM container to make the changes live on your website.
Step 1 – Submit:
- Go back to GTM.
- Click Submit.
- Create a New Version (e.g., version name “GA4 Setup”).
- Click Publish.
Step 2 – Version History:
GTM saves version history, allowing you to:
- Roll Back: Revert to older versions.
- Export/Import: Move containers between environments.
Step 3 – Confirmation:
Your GA4 is now permanently connected. All tags, triggers, and variables you configured are now live.
Importance
Publishing makes your tracking live. Version history provides safety and rollback capability.
Example: A marketer completes testing, clicks “Submit,” names the version “GA4 Setup – v1.0,” and publishes. The GA4 tag is now live on the website, and data begins flowing into GA4.
5. Google Tag Manager (GTM) Deep Dive
5.1 What is GTM and Why Use It?
Google Tag Manager is a tag management system that allows you to deploy tracking codes (tags) without repeatedly editing website code. It acts as a mediator between your website and analytics tools.
GTM Core Functions:
- Tag Management: Add, update, and remove tags from a single dashboard.
- Trigger Configuration: Define when tags should fire (e.g., all pages, specific clicks, form submissions).
- Variable Management: Define dynamic values used by tags and triggers.
- Version Control: Track changes and roll back if needed.
- User Permissions: Control access at the workspace level.
Why GTM Instead of Direct Code?
| Without GTM | With GTM |
|---|---|
| Edit website code for each tag | Manage all tags from one dashboard |
| Developer needed for every change | Marketers can make changes independently |
| No version control | Version history and rollback |
| Difficult to manage multiple tags | Centralized tag management |
| Limited flexibility | Unlimited flexibility with custom triggers |
Importance
GTM is mandatory for professionals. It saves time, reduces errors, and provides unmatched flexibility.
Example: A marketing team needs to add Facebook Pixel, LinkedIn Insight Tag, and Hotjar to their website. Without GTM, they would need a developer to edit the website code three times. With GTM, they add all three tags in 15 minutes through the dashboard, test them in Preview mode, and publish—all without developer involvement.
5.2 GTM Core Concepts – Tags, Triggers, Variables
Understanding the three core concepts of GTM—Tags, Triggers, and Variables—is essential for using GTM effectively.
| Concept | Definition | Example |
|---|---|---|
| Tag | A code snippet that fires an action | GA4 Configuration tag, Facebook Pixel, Google Ads conversion tag, custom HTML tag |
| Trigger | Condition that tells when a tag should fire | All Pages, Page View, Click (button click), Form Submission, Page URL contains /thankyou |
| Variable | A dynamic value used by tags and triggers | Page URL, Click URL, Click Text, Data Layer Variable, Constant Variable (Measurement ID) |
Tag Types:
- Google Tag (GA4 Configuration): Sets up GA4 measurement.
- GA4 Event Tag: Sends custom events.
- Custom HTML: Execute custom JavaScript.
- Google Ads Conversion Tracking: Track conversions.
- Facebook Pixel: Track Facebook events.
- LinkedIn Insight Tag: Track LinkedIn activity.
- Hotjar: User behavior tracking.
Trigger Types:
- Page View: Fires on page loads.
- Click: Fires on clicks (all clicks, specific link clicks, button clicks).
- Form Submission: Fires when a form is submitted.
- Custom Event: Fires on custom events from the data layer.
- Timer: Fires after a specific time interval.
- Scroll Depth: Fires when a user scrolls to a certain depth.
Variable Types:
- Built-in Variables: Page URL, Page Title, Click URL, Click Text, Form ID.
- User-Defined Variables: Data Layer Variables, Constant Variables (e.g., Measurement ID), Lookup Tables.
Importance
Mastering Tags, Triggers, and Variables enables you to track virtually any user interaction on your website.
Example: A marketer wants to track clicks on a “Download Now” button. They create:
- Variable: Click Text (built-in variable).
- Trigger: Click → Specific Element → Click Text equals “Download Now”.
- Tag: GA4 Event → Event Name
download_click→ Event Parameters:link_text= {{Click Text}}.
5.3 Connecting GA4 Tag with GTM (Step by Step)
Connecting your GA4 property to GTM is the most common GTM setup. It allows you to send data from your website to GA4 through GTM.
Step-by-Step Process:
- Open GTM → Tags → New.
- Tag Type → Select Google Tag (GA4 Configuration).
- Paste your Measurement ID (from GA4 data stream, format
G-XXXXXXX). - Trigger → Select All Pages.
- Save the tag.
- Preview and verify the tag fires.
- Publish the container.
Configuration Options:
- Send Page View: Enabled by default.
- Send Event: Used for custom events.
- User Properties: Set user-level attributes.
Importance
Proper GA4 tag configuration is essential for accurate data collection.
Example: A marketer creates a GA4 Configuration tag in GTM. They paste the Measurement ID G-ABC123XYZ and set the trigger to “All Pages”. They preview the container, navigate to their website, and see the tag “Fired” in the preview window. They publish the container, and GA4 starts receiving data.
5.4 Workspace & Versions in GTM
Workspaces and versions are essential GTM features for managing changes and maintaining control over your tracking implementation.
Workspace:
- The environment where you create and edit tags, triggers, and variables.
- Like a draft or sandbox.
- You can have multiple workspaces (e.g., Development, Staging, Production).
Version:
- When you publish, GTM saves a snapshot (version history).
- Each version has a number and a description.
- You can roll back to older versions.
- You can export or import containers.
Version Management:
- Version 1: Initial GA4 setup.
- Version 2: Added Facebook Pixel.
- Version 3: Added click tracking.
- Rollback: If Version 3 causes issues, roll back to Version 2.
Importance
Version control allows you to:
- Track Changes: Know what was changed and when.
- Roll Back: Revert to a stable version.
- Collaborate: Multiple team members can work in different workspaces.
Example: A marketer has a workspace called “Development” where they test new tags. After testing, they publish the container, creating Version 5 with the description “Added form submission tracking.” If the new tracking causes issues, they can quickly roll back to Version 4.
5.5 Advanced Tracking Using GTM
Once GA4 is connected, you can track a wide range of user interactions using GTM—button clicks, form submissions, scroll depth, and custom events.
Common Advanced Tracking Scenarios:
1. Button Click Tracking:
- Trigger: Click → Specific Element → Click ID/Class/Text matches.
- Tag: GA4 Event → Event Name
button_click→ Parameters:button_text,button_url.
2. Form Submission Tracking:
- Trigger: Form Submission → Specific Form → Form ID matches.
- Tag: GA4 Event → Event Name
form_submit→ Parameters:form_id,form_name.
3. Thank-You Page Conversion Tracking:
- Trigger: Page View → Page URL contains
/thankyou. - Tag: GA4 Event → Event Name
conversion→ Parameters:transaction_id,revenue.
4. Scroll Depth Tracking:
- Trigger: Scroll Depth → 25%, 50%, 75%, 90%.
- Tag: GA4 Event → Event Name
scroll_depth→ Parameters:percent_scrolled.
5. File Download Tracking:
- Trigger: Click → Click URL matches regex
\.(pdf|xlsx|docx|zip)$. - Tag: GA4 Event → Event Name
file_download→ Parameters:file_url,file_name.
6. Outbound Link Tracking:
- Trigger: Click → Click URL does not contain your domain.
- Tag: GA4 Event → Event Name
outbound_link→ Parameters:link_url,link_text.
Workflow:
- Define Trigger: What action should trigger the event?
- Define Variables: What data should be captured?
- Define Tag: What event name and parameters should be sent?
- Preview & Test: Verify the tag fires correctly.
- Publish: Make the tracking live.
Importance
Advanced tracking provides deep insights into user behavior, enabling data-driven optimization.
Example: An e-commerce store sets up GTM to track “Add to Cart” button clicks. They create a trigger for clicks on elements with the class add-to-cart. They create a GA4 Event tag with event name add_to_cart and parameters product_id, product_name, price. They preview and test, then publish. Now they can see exactly which products are being added to carts.
6. Event Tracking in GA4
6.1 What Are Events and How to Track Them
Event tracking measures specific user interactions: clicks, downloads, scrolls, form submissions, video plays, and more. In GA4, everything is an event—the event-based data model is the foundation of GA4.
What is an Event?
An event is any user interaction or system occurrence that is tracked and sent to GA4. Events have:
- Event Name: The name of the action (e.g.,
page_view,click,purchase). - Parameters: Additional data about the event (e.g.,
page_title,click_url,product_id).
How to Track Events:
- Automatically Collected Events: Fired by GA4 without any extra setup.
- Enhanced Measurement Events: Enabled in GA4 Admin (scrolls, outbound clicks, downloads, site search, video engagement).
- Recommended Events: Pre-defined event names that GA4 recognizes for better reporting.
- Custom Events: User-defined events created via GTM or the data layer.
Importance
Events are the building blocks of GA4 tracking. Without events, you cannot measure user interactions beyond page views.
Example: A content website tracks video plays as events. Each time a user plays a video, an event video_play is sent with parameters video_title and video_duration. This data helps the content team understand which videos are most engaging.
6.2 Types of Events – Automatically Collected, Enhanced, Recommended, Custom
GA4 classifies events into four types. Understanding these categories helps you choose the right tracking approach.
| Type | Description | Example Events |
|---|---|---|
| Automatically Collected | Fired by GA4 without any extra setup | page_view, session_start, first_visit, user_engagement |
| Enhanced Measurement | Can be enabled in GA4 Admin → Data Stream → Web → Enhanced Measurement | scroll, click (outbound), file_download, site_search, video_start, video_progress, video_complete |
| Recommended Events | Pre-defined event names that GA4 recognizes for better reporting | generate_lead, purchase, add_to_cart, begin_checkout, sign_up |
| Custom Events | User-defined events created via GTM or the data layer | nav_click, video_start, consultation_booked, menu_open |
Enhanced Measurement Details:
- Page Views: Standard page tracking.
- Scrolls: When a user scrolls to 90% of the page.
- Outbound Clicks: Clicks on links to external domains.
- Site Search: Searches performed on your site.
- Video Engagement: Plays, progress, and completions for embedded videos.
- File Downloads: Clicks on links to common file types (pdf, docx, xlsx, etc.).
Recommended Events:
Using recommended events improves GA4’s reporting capabilities. Examples:
purchase: Use for completed purchases.add_to_cart: Use for adding items to cart.begin_checkout: Use for starting the checkout process.sign_up: Use for user registrations.generate_lead: Use for lead generation.
Importance
Using the right event type ensures accurate data collection and better reporting.
Example: An e-commerce site uses the recommended event purchase for completed orders. GA4 recognizes this event and automatically populates the E-commerce reports with revenue, product information, and transaction data.
6.3 Example – Click Event Setup in GTM
Setting up a click event in GTM allows you to track when users click on specific elements (buttons, links, images) on your website.
Step-by-Step Setup:
- GTM → Tags → New → Tag Type → GA4 Event.
- Paste your Measurement ID.
- Event Name:
nav_click(or any custom name). - Event Parameters:
link_url→ Set to{{Click URL}}(built-in variable).link_text→ Set to{{Click Text}}(built-in variable).
- Trigger: Click → All Clicks or Specific Element.
- For Specific Element:
- Click → Just Links (for tracking only link clicks).
- Click → Specific Element → Click ID/Class/Text matches criteria.
- Preview and verify that the event fires when the button is clicked.
- Publish the container.
Built-in Click Variables:
{{Click URL}}: The URL of the clicked link.{{Click Text}}: The visible text of the clicked element.{{Click ID}}: The ID of the clicked element.{{Click Classes}}: The CSS classes of the clicked element.
Importance
Click event tracking provides insights into user interactions and navigation patterns.
Example: A B2B website has a “Request a Demo” button. The marketer sets up a click event in GTM with event name demo_request and parameters button_text and page_url. When users click the button, the event fires, allowing the marketer to track how many demo requests are generated.
7. Goals, Conversions & Funnels
7.1 UA Goals vs GA4 Conversions
In Universal Analytics, Goals were used to track completed actions. In GA4, Conversions replace Goals, and the approach is significantly different.
Universal Analytics (UA) Goals:
- Admin → View → Goals (max 20 goals).
- Types:
- Destination: User reaches a specific page (e.g., thank-you page).
- Duration: User spends a specific amount of time on site.
- Pages/Session: User views a specific number of pages.
- Event: User completes a specific event (e.g., video play).
- Limit: 20 goals per view.
Google Analytics 4 (GA4) Conversions:
- Admin → Conversions.
- Any event can be marked as a conversion.
- No arbitrary limit.
- Event Name: Must match an existing event name.
Marking an Event as a Conversion:
- Go to GA4 Admin → Conversions.
- Click New Conversion Event.
- Enter the exact event name (e.g.,
purchase,form_submit). - Save.
- Existing events can be marked as conversions by toggling the switch next to the event name.
Understanding the difference helps you configure tracking correctly and interpret reports accurately.
Example: A marketer migrates from UA to GA4. In UA, they had a goal for form submissions called “Form Submission.” In GA4, they mark the event form_submit as a conversion. The conversion shows up in the Conversions report, and they can see how many form submissions occurred.
7.2 Marking an Event as a Conversion in GA4
Marking an event as a conversion tells GA4 that this event represents a valuable user action that should be tracked and reported as a conversion.
Step-by-Step Process:
- GA4 Admin → Conversions.
- New Conversion Event.
- Enter Event Name: Must match an existing event name exactly.
- Example:
purchase,sign_up,generate_lead,form_submit.
- Example:
- Save.
- Existing Events: Toggle the switch next to the event name to mark it as a conversion.
Important Notes:
- Case Sensitive: Event names are case-sensitive (
purchase≠Purchase). - No Limit: There is no arbitrary limit on the number of conversion events.
- Historical Data: After marking an event as a conversion, GA4 starts counting it from that point forward (not retroactively).
Importance
Marking conversions is essential for tracking success metrics and measuring ROI.
Example: An e-commerce store marks purchase as a conversion. Now, every purchase event is counted as a conversion. The store can see total conversions, conversion rate, and revenue in the Conversions report.
7.3 Funnel Analysis
A funnel maps the sequence of steps users take on their path to conversion. Funnel analysis helps identify where users drop off and where to optimize.
Example Funnel:
- Product Page → 2. Add to Cart → 3. Checkout → 4. Order Confirmation
Step-by-Step Funnel Analysis in GA4:
- GA4 → Explore → Funnel Exploration.
- Define the steps (event names).
- Add conditions (e.g., product category, traffic source).
- Analyze drop-off rates.
Key Metrics:
- Drop-off Rate: Percentage of users who do not proceed to the next step.
- Conversion Rate: Percentage of users who complete the funnel.
- Time to Convert: Average time between first touch and conversion.
Importance
Funnel analysis reveals optimization opportunities. If a large percentage of users drop off at the checkout step, the checkout process needs improvement.
Example: An e-commerce store creates a funnel: product_view → add_to_cart → begin_checkout → purchase. They discover that 40% of users drop off at the checkout step. This insight prompts them to simplify the checkout form, reducing drop-off to 20% and increasing conversions.
8. Important Reports in Google Analytics
8.1 Real-Time Reports
Real-Time Reports show live users on your website right now. They provide immediate visibility into current activity.
What You See:
- Active Users: Number of users currently on your site.
- Current Traffic Sources: Where users are coming from (organic, paid, direct, referral, social).
- Events Occurring: Live events being fired.
- Top Active Pages: Which pages users are viewing right now.
- Conversions: Conversions occurring in real-time.
Use Cases:
- Track Campaign Launch Effects: See immediate traffic from a social media post or email campaign.
- Test Tracking: Verify that new tags are firing correctly.
- Monitor Website Issues: If traffic suddenly drops, there may be a technical issue.
Importance
Real-Time Reports provide immediate feedback on marketing campaigns and technical changes.
Example: A social media manager posts a new Instagram story with a link to a blog post. They watch Real-Time Reports and see a surge in traffic from social sources, confirming the story is driving engagement.
8.2 Audience Reports
Audience Reports reveal who your users are—demographics, location, technology, and interests.
Key Reports:
- Demographics: Age, gender of users.
- Geo: Location (country, city, region).
- Technology: Device category (desktop, mobile, tablet), browser, operating system.
- Interests: Affinity categories (long-term interests) and In-Market segments (active purchasing intent).
Use Cases:
- Optimize for Mobile: If 70% of traffic comes from mobile, prioritize mobile optimization.
- Target Ads: Use demographic and interest data for ad targeting.
- Localize Content: If most users are in a specific region, consider localizing content.
Importance
Audience data enables targeted marketing and user experience optimization.
Example: A travel website discovers that 60% of its users are aged 25-34 and interested in “Budget Travel.” They create targeted content and ads for this audience, increasing engagement and bookings.
8.3 User Explorer (UA) vs User ID (GA4)
User Explorer (UA) and User ID (GA4) are features for understanding individual user behavior.
User Explorer (UA):
- Shows individual user behavior based on Client ID (device-specific).
- A user on a phone and a laptop appears as two different users.
- Limited cross-device tracking.
User ID (GA4):
- Tracks users across devices when you implement User ID.
- The same person is recognized on phone, tablet, and desktop.
- Provides a true cross-device picture.
How to Implement User ID:
- Assign a unique User ID to each authenticated user to distinguish them across sessions.
- Send the User ID with every hit.
- GA4 associates all activity from that user across devices.
Importance
User ID enables a complete view of the customer journey across devices.
Example: An e-commerce site implements User ID. A user browses products on their phone, adds an item to cart on their tablet, and completes the purchase on their desktop. With User ID, GA4 recognizes this as a single user journey, providing accurate attribution and customer lifetime value data.
8.4 Behavior Reports
Behavior Reports show how users interact with your content.
Key Metrics:
- Page Views: Number of times a page was viewed.
- Unique Page Views: Number of sessions that included the page.
- Average Time on Page: How long users spend on a page.
- Bounce Rate (UA): Percentage of sessions where users leave after viewing only one page.
- Engagement Rate (GA4): Percentage of sessions that lasted ≥10 seconds, had a conversion, or had ≥2 page views.
- Exit Rate: Percentage of sessions that end on a specific page.
Use Cases:
- Identify High-Performing Content: Which pages get the most views and engagement.
- Optimize Low-Performing Pages: High bounce rate suggests content or load time issues.
- Improve Navigation: Understand where users drop off.
Importance
Behavior Reports guide content optimization and user experience improvements.
Example: A blog owner discovers that a specific article has a 90% bounce rate. They revamp the article with better visuals, shorter paragraphs, and internal links. The bounce rate drops to 60%, and engagement increases.
8.5 Acquisition Reports
Acquisition Reports answer the question: How do users find your website?
Traffic Sources:
- Organic Search: From Google, Bing, DuckDuckGo, etc.
- Paid Search: From Google Ads campaigns.
- Referral: From links on other websites.
- Social: From social media platforms (Facebook, Instagram, LinkedIn, Twitter, etc.).
- Direct: Typed URL or bookmarked.
- Email: From email campaigns (with proper UTM tagging).
- Affiliate: From affiliate links.
Use Cases:
- Budget Allocation: If paid search traffic has a high conversion rate, increase that budget.
- Content Strategy: If social traffic has low engagement, revisit your social content strategy.
- Channel Performance: Compare traffic quality across channels.
Importance
Acquisition Reports show which marketing channels are most effective.
Example: A marketer analyzes Acquisition Reports and sees that paid search drives 40% of conversions but only 20% of traffic. Social media drives 30% of traffic but only 10% of conversions. They shift budget from social media to paid search, improving overall ROI.
8.6 Advanced Reports – Custom, Explore, Advertising
GA4 provides advanced reporting tools for deeper analysis: Custom Reports, the Explore Tab, and the Advertising Tab.
Custom Reports:
- Create reports based on custom dimensions and metrics that matter to your business.
- Example: Report showing revenue by product category and traffic source.
Explore Tab (GA4):
Advanced analysis tools:
- Funnel Exploration: Build custom funnels and see drop-off.
- Path Analysis: See the paths users take through your site.
- Segment Overlap: Compare user segments.
- Cohort Analysis: Analyze user retention over time.
- User Lifetime: Understand long-term user value.
Advertising Tab:
- Campaign Performance: Track Google Ads campaigns.
- Attribution Reports: Understand the customer journey and attribution.
- Conversion Paths: See the sequences of touchpoints that lead to conversions.
- ROAS: Return on Ad Spend.
Importance
Advanced reports provide deeper insights for strategic decision-making.
Example: A marketer uses Funnel Exploration to analyze the checkout funnel. They discover that users from mobile devices drop off at 60% compared to 30% on desktop. They optimize the mobile checkout experience and see conversions increase.
8.7 Audience Insights – LTV, Cohort Analysis, In-Market Segments
Audience Insights help you understand your users’ long-term value, behavior patterns, and purchasing intent.
Lifetime Value (LTV):
- Measures total revenue and engagement a user brings over their entire lifecycle.
- Used to identify high-value customer segments.
- Helps in marketing budget allocation.
Cohort Analysis:
- Groups users by a shared characteristic (e.g., acquisition month).
- Tracks retention and behavior over time.
- Example: January cohort retention after 3 months vs February cohort.
In-Market Segments:
- Users actively researching or comparing products in specific categories.
- Examples: “Apparel,” “Electronics,” “Travel.”
- Used for Google Ads targeting.
Affinity Categories:
- Users with long-term interests.
- Examples: “Sports,” “Travel,” “Fashion.”
- Used for audience targeting.
Importance
Audience insights enable personalized marketing and better customer retention.
Example: A subscription service analyzes LTV and discovers that users acquired through organic search have a 40% higher LTV than those from paid ads. They shift focus to SEO to attract more high-value users.
9. Data Retention & Search Console Integration
9.1 Data Retention Settings
Data Retention Settings determine how long GA4 keeps user-level data before automatically deleting it.
GA4 → Admin → Data Settings → Data Retention.
- Default: 14 months.
- Options: 2, 14, 26, 38, or 50 months (depending on property type).
- What is Deleted: User-level data (e.g., individual events, user IDs) is automatically deleted after the retention period.
- What is Kept: Aggregated reports are not affected.
Importance
Setting the retention period appropriately ensures you have enough historical data while complying with privacy regulations.
Example: A business wants to analyze annual user behavior. They set the data retention period to 50 months to ensure they have a full year of data for year-over-year comparisons.
9.2 Google Search Console Integration
Google Search Console shows search performance data (impressions, clicks, average position) even if the user did not visit your website. Integrating it with GA4 provides a complete picture of search performance and user behavior.
How to Integrate:
- GA4 → Admin → Property Settings → Search Console.
- Link with your verified GSC property.
Benefits:
- See which search queries drive impressions and clicks to your site.
- Combine GSC data with GA4 behavior data (e.g., engagement rate for organic landing pages).
- View Search Console cards inside GA4 reports (Acquisition → Search Console).
What You Can Analyze:
- Impressions: How many times your site appeared in search results.
- Clicks: How many times users clicked on your site.
- CTR: Click-through rate.
- Average Position: Average rank in search results.
- Query Performance: Which keywords drive traffic.
Importance
Search Console integration helps you understand and optimize your organic search performance.
Example: A website owner integrates Search Console with GA4. They discover that a specific keyword drives many impressions but low clicks. They optimize their meta description and title tag for that keyword, increasing CTR from 2% to 5%.
10. Google Marketing Platform Organization
10.1 When to Create an Organization
An Organization is the top-level container in Google Marketing Platform. It provides centralized management of multiple GA accounts.
When to Create an Organization:
- You manage multiple GA accounts (e.g., multiple clients or business units).
- You need centralized user access control.
- You need centralized billing control.
- You are an agency or a large enterprise.
Steps to Create an Organization:
- Visit analytics.google.com, select All Accounts, and open Platform Home.
- Go to Administration → Create Organization.
- Enter an organization name.
- Assign existing accounts to the organization.
Important Note:
- A GA account cannot belong to multiple organizations.
- For a small business, just create a GA account directly—you do not need an Organization.
Importance
Organizations provide centralized control for large or multi-account setups.
Example: A digital marketing agency with 50 clients creates an Organization called “Agency Name.” They add all client accounts under this Organization. Now, they can manage user permissions and billing centrally.
11. Integrating Google Analytics with Other Platforms
11.1 Magento 2 Integration
Integrating Google Analytics with Magento 2 allows e-commerce businesses to track sales, user behavior, and marketing performance.
Method 1 – Direct (GA ID/Measurement ID):
- Magento Admin → Stores → Configuration → Sales → Google API.
- Paste your GA tracking ID (UA) or Measurement ID (GA4).
- Clear Magento cache.
Method 2 – Using Extension (Recommended for GA4):
- Extensions such as Magefan or Meetanshi.
- Install the extension, paste your GTM ID or Measurement ID.
- Generate JSON, import container in GTM.
Method 3 – GTM Method (Most Flexible):
- Install a GTM extension for Magento 2.
- Paste your GTM ID.
- Create GA4 tag inside GTM (as shown in Section 5.3).
- Enable Enhanced Ecommerce tracking in GTM if needed.
Proper integration ensures accurate e-commerce tracking and conversion measurement.
Example: A Magento 2 store integrates GA4 using the GTM extension. They track product impressions, add-to-cart events, checkout steps, and purchases. The Enhanced Ecommerce reports in GA4 provide insights into the shopping behavior funnel.
11.2 Blogger Integration
Integrating Google Analytics with Blogger allows blog owners to track traffic and user behavior.
- In GA4, create a data stream for your blog’s URL.
- Copy the global site tag (
gtag.js). - Go to Blogger → Theme → Edit HTML.
- Paste the tracking code just before the closing
</head>tag. - Save theme.
Alternative Method:
- Use a Blogger plugin or widget to add the tracking code.
Importance
Blogger integration provides insights into blog traffic and reader behavior.
Example: A blogger integrates GA4 with Blogger. They discover that their top-performing content receives 70% of their traffic. They create more content on similar topics to grow their audience.
12. Testing & Debugging
12.1 Testing Tools
Testing and debugging ensure accurate data collection and prevent tracking issues.
| Tool | How to Use |
|---|---|
| GTM Preview Mode | Click “Preview” in GTM, enter website URL, browse the site. See which tags fire in real time. |
| GA4 DebugView | In GA4 Admin → DebugView. Send debug_mode parameter (GTM can enable it). See each event as it arrives. |
| Real-Time Reports | After publishing, check GA4 → Reports → Real-Time. Verify that events and page views appear within seconds. |
| Tag Assistant (Chrome extension) | Records all GTM and GA hits on a page; useful for deep diagnostics. |
| Browser Console | Check for JavaScript errors that may prevent tracking. |
Verification Checklist:
- Tag fires in GTM Preview.
- Event appears in GA4 DebugView.
- Real-Time shows active user.
- (For conversions) The event is marked as a conversion in GA4 Admin → Conversions.
- Data appears in standard reports after 24-48 hours.
Importance
Testing prevents data loss and ensures accurate tracking.
Example: A marketer sets up a new event in GTM. They use Preview mode to see the tag fire. They check DebugView to confirm the event arrives in GA4. They check Real-Time to see the active user. Everything works, so they publish.
13. Strategy Using Google Analytics
13.1 Turning Data into Action
Google Analytics data is only valuable when it leads to action. This section outlines a five-step strategy for using GA data to drive business growth.
| Step | Action | Tool / Report |
|---|---|---|
| 1. Understand Your Audience | Analyze demographics, location, devices, interests | Audience Reports, User Explorer, LTV |
| 2. Set Conversions | Define what a successful user action is (purchase, sign-up, lead) | GA4 → Conversions (mark relevant events) |
| 3. Analyze Behavior | Identify high-bounce pages, low-engagement content, drop-off points | Behavior Reports, Funnel Exploration, Path Analysis |
| 4. Optimize Acquisition Channels | Compare traffic source performance (CAC, conversion rate, ROAS) | Acquisition Reports, Advertising Tab, Attribution |
| 5. Monitor in Real Time | Track live campaigns, test new landing pages, debug tag issues | Real-Time Reports, DebugView, GTM Preview |
Ongoing Cycle: Measure → Analyze → Optimize → Repeat.
Importance
A structured strategy ensures that data leads to continuous improvement and business growth.
Example: A SaaS company uses this strategy: They analyze their audience and discover most users are age 25-34 in the US. They set conversions as sign_up and trial_start. They analyze behavior and discover the pricing page has a 60% bounce rate. They optimize the pricing page and see conversions increase by 15%.
14. Final Summary & Conclusion
Google Analytics (especially GA4) together with Google Tag Manager gives you a complete, future-proof tracking infrastructure.
What You Can Do with GA4 + GTM:
- Track Users Across Devices: Using User ID for cross-device tracking.
- Measure Every Meaningful Interaction: Events for clicks, scrolls, downloads, video plays, form submissions.
- Understand Marketing Channel Performance: Which channels drive the most valuable traffic.
- Build Conversion Funnels: See exactly where users drop off.
- Use Machine Learning Insights: Predictive audiences, churn probability, purchase probability.
- Integrate with Other Platforms: Google Ads, Search Console, Facebook Pixel, LinkedIn Pixel, Hotjar, and dozens of others.
Why GTM is Mandatory:
- Install once, manage all tags from a single interface.
- No developer needed for everyday tracking changes.
- Version control and rollback.
- Supports GA, Google Ads, Facebook Pixel, LinkedIn Pixel, Hotjar, and custom JavaScript.
Final Conclusion:
Proper Google Analytics setup (especially with GTM) enables:
- Data-Driven Marketing: Make decisions based on real data.
- Better User Experience: Optimize based on user behavior.
- Accurate Conversion Tracking: Know what’s working.
- Strategic Growth: Allocate resources effectively.
In 2026 and beyond, mastering GA4 + GTM is a mandatory skill for every digital professional.
15. Troubleshooting Common Issues
15.1 Tracking Not Working
Common issues that prevent tracking from working and how to fix them.
Common Issues and Solutions:
| Issue | Cause | Solution |
|---|---|---|
| No data in GA4 | Tracking code not installed or blocked | Check code placement, test in Preview/DebugView |
| Data appears but incomplete | Ad blocker or script blockers | Check if ad blockers are preventing tracking |
| GTM tag not firing | Trigger not configured correctly | Review trigger conditions in Preview mode |
| Double tracking | Multiple GA codes | Remove duplicate codes |
| Events not appearing in reports | Events not marked as conversions (if needed) | Mark events as conversions in GA4 Admin |
| Cross-device tracking not working | User ID not implemented | Implement User ID properly |
| Data retention too short | Data retention period set to short | Adjust Data Retention settings |
Troubleshooting ensures accurate data collection and reliable reporting.
Example: A marketer sets up GA4 but sees no data after 24 hours. They use GTM Preview and find the GA4 Configuration tag is not firing. They check the trigger and realize it was set to “Some Pages” instead of “All Pages.” They fix the trigger, preview again, see the tag fires, publish, and data starts flowing.
16. Privacy and Compliance
16.1 GDPR and GA4
Privacy regulations like GDPR and CCPA require businesses to protect user data. GA4 is built to prioritize user privacy and responsible data collection.
GA4 Privacy Features:
- No IP Storage: GA4 does not store IP addresses by default (unlike UA, which stored IP).
- Data Retention: Configurable retention periods (up to 50 months).
- Consent Mode: Integrates with consent management platforms.
- User Deletion: Ability to delete user data on request.
- Data Sharing: Users can control data sharing with Google.
Key Requirements:
- Consent: Obtain user consent before tracking (cookie consent banners).
- Privacy Policy: Clearly disclose what data is collected and how it is used.
- Data Subject Rights: Allow users to access, modify, or delete their data.
Importance
Compliance with privacy regulations is essential to avoid fines and maintain user trust.
Example: A European e-commerce site implements a cookie consent banner. They use Google Consent Mode to adjust tracking based on user consent. If a user does not consent, GA4 receives limited data (no cookies), ensuring compliance with GDPR.
Appendix: Quick Reference
A.1 Key GA4 Events
| Event Name | Description |
|---|---|
page_view | Page load |
session_start | Session begins |
first_visit | First visit ever |
user_engagement | Session engagement |
scroll | Scrolled to 90% of page |
click | Outbound link click |
file_download | File downloaded |
site_search | Site search performed |
video_start | Video started |
video_progress | Video progressed |
video_complete | Video completed |
purchase | Purchase completed |
add_to_cart | Added to cart |
begin_checkout | Started checkout |
sign_up | User signed up |
generate_lead | Lead generated |
A.2 Key GTM Variables
| Variable | Description |
|---|---|
{{Page URL}} | Full URL of the page |
{{Page Title}} | Title of the page |
{{Click URL}} | URL of clicked link |
{{Click Text}} | Text of clicked element |
{{Click ID}} | ID of clicked element |
{{Click Classes}} | CSS classes of clicked element |
{{Form ID}} | ID of the form |
{{Form Classes}} | CSS classes of the form |
{{Container ID}} | GTM container ID |